
Cathodic Protection Network International Limited
Pipeline Corrosion Control
Registered at Companies House in the UK
Name & Registered Office:
CATHODIC PROTECTION NETWORK INTERNATIONAL LIMITED
74 DALCROSS
BRACKNELL
BERKSHIRE
RG12 0UL
Company No. 08505715
Cathodic Protection Network Laboratory
This laboratory has been assembled over time to repeatedly demonstrate features of the application of corrosion control and cathodic protection.
The instruments have all been purchased at retail outlets and have specifications that meet the requirements of international codes of practice in corrosion control science.
Pictures of established national laboratories and research establishments have been examined and visits have been made to universities and companies in many countries and on many continents.
Although this laboratory is in private accommodation it is as valid as any laboratory anywhere.

The most basic assumption of applied cathodic protection is that the copper/copper-sulphate electrode can be used as a reference potential to prove that corrosion has been controlled by the application of electrical energy into the anodes of corrosion cells that might be on a pipeline or structure.

This experiment with three nails and a source of electrical energy allows us to make repeated observations of the corrosion process and cathodic protection measurable with the instruments that we use in field work.

It shows that the voltage measurements that we call 'pipe-to-soil potentials' vary with the position of the copper/copper-sulphate electrode. It shows us exactly what the meter is capable of measuring and that we cannot measure electrons or ions. It is our own 'equivalent circuit' that we can measure and examine.
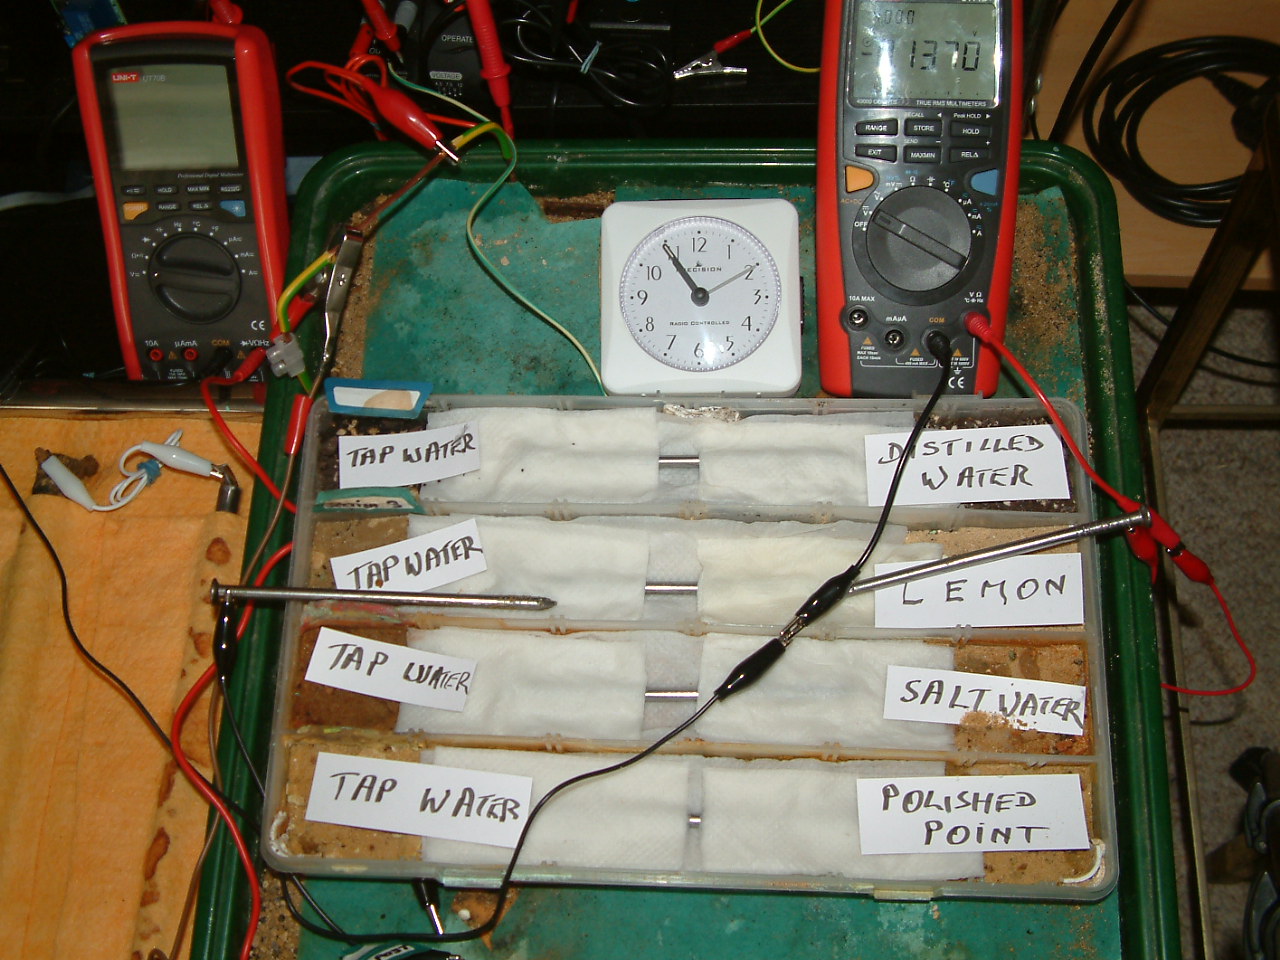
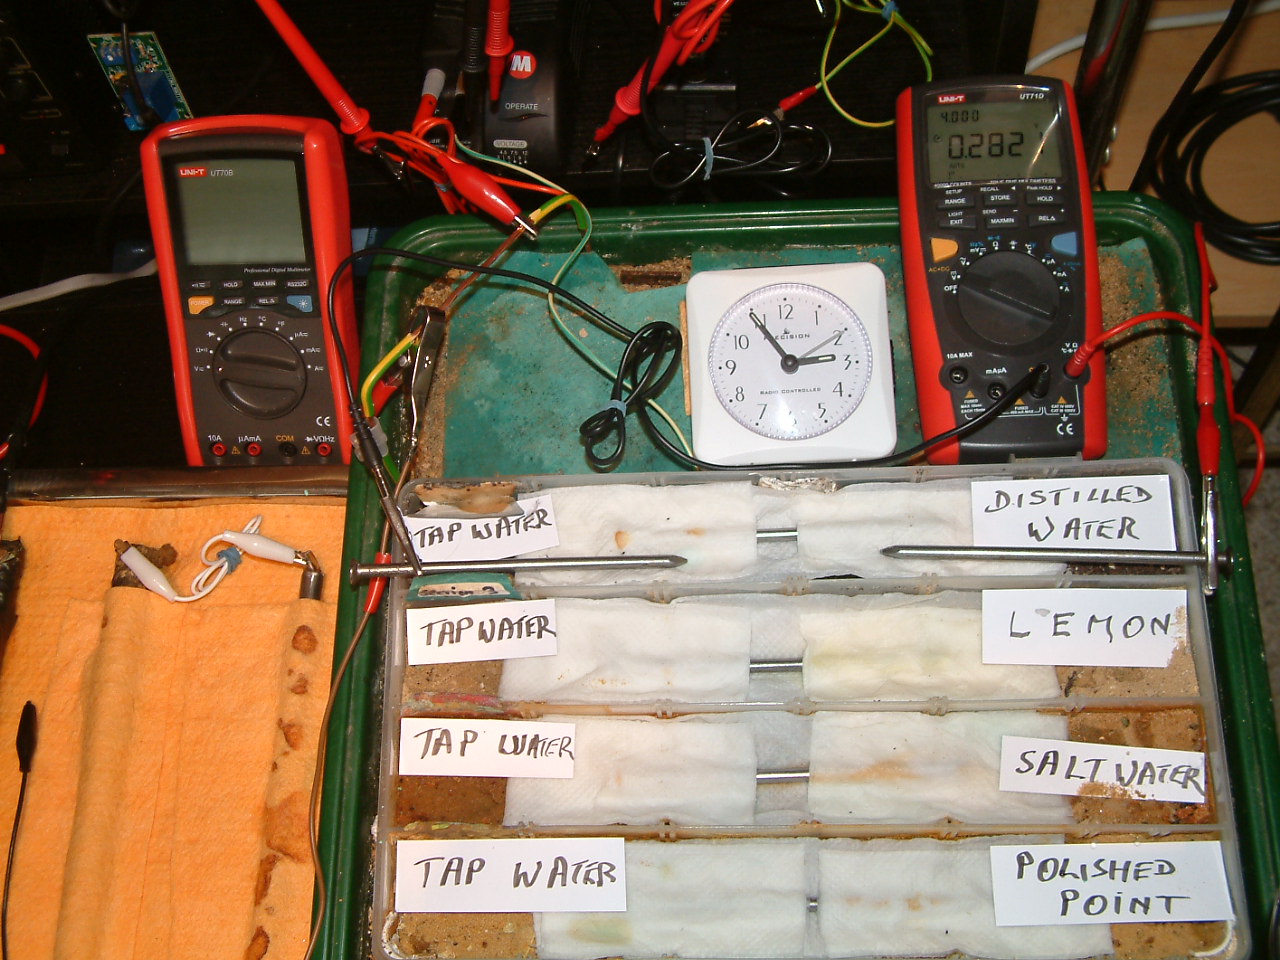
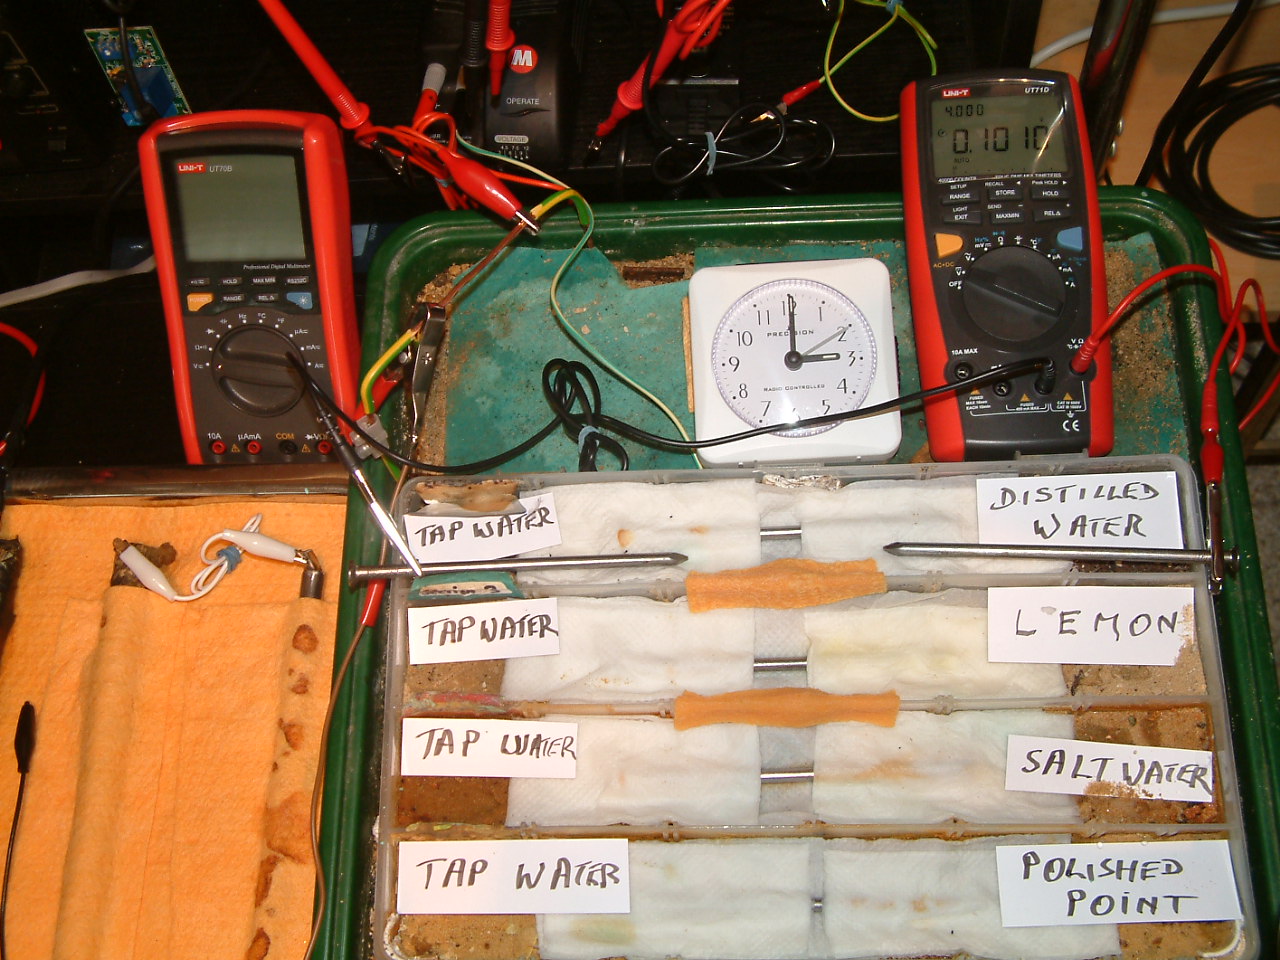
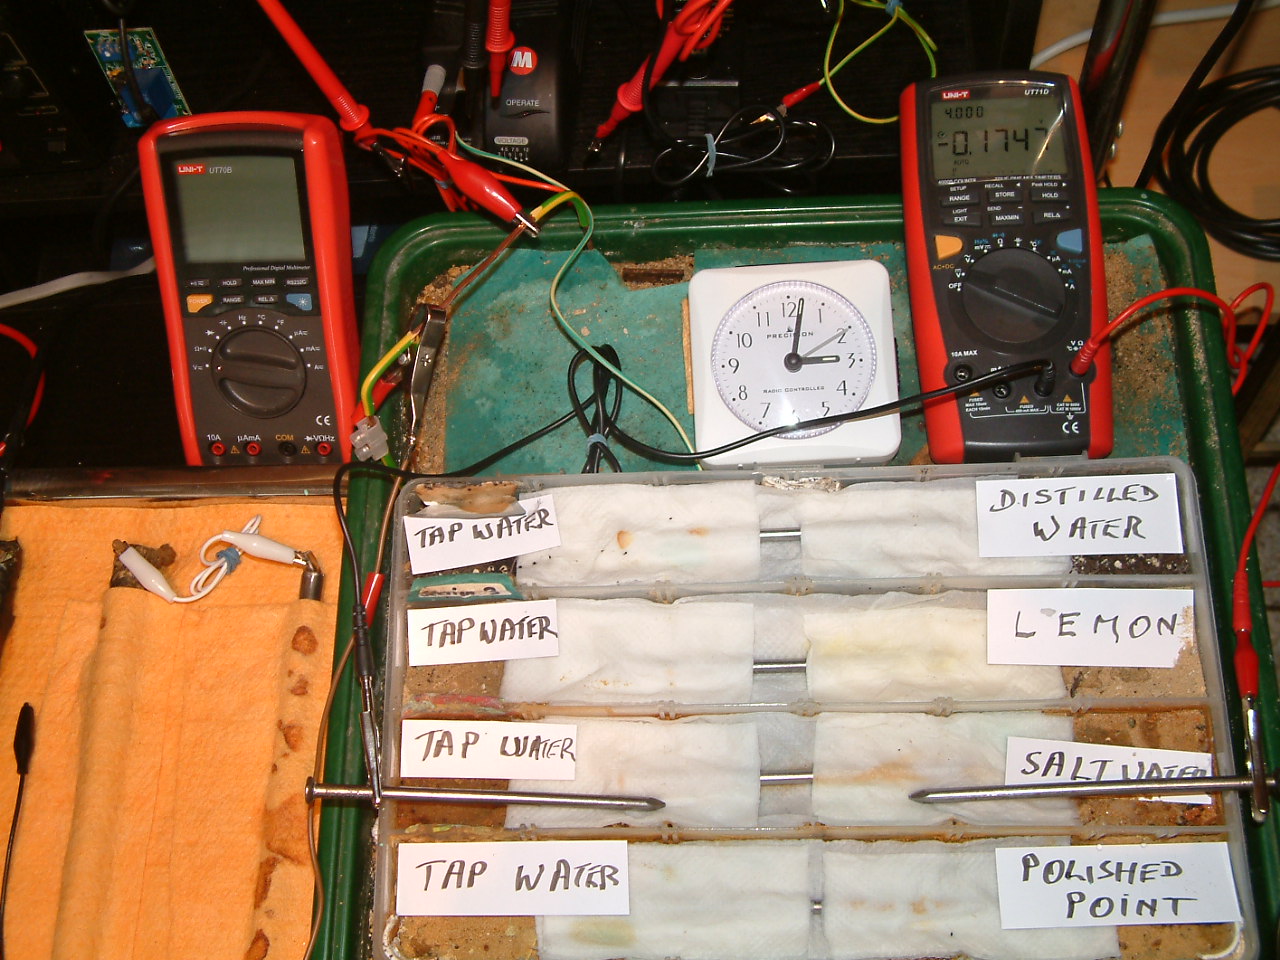
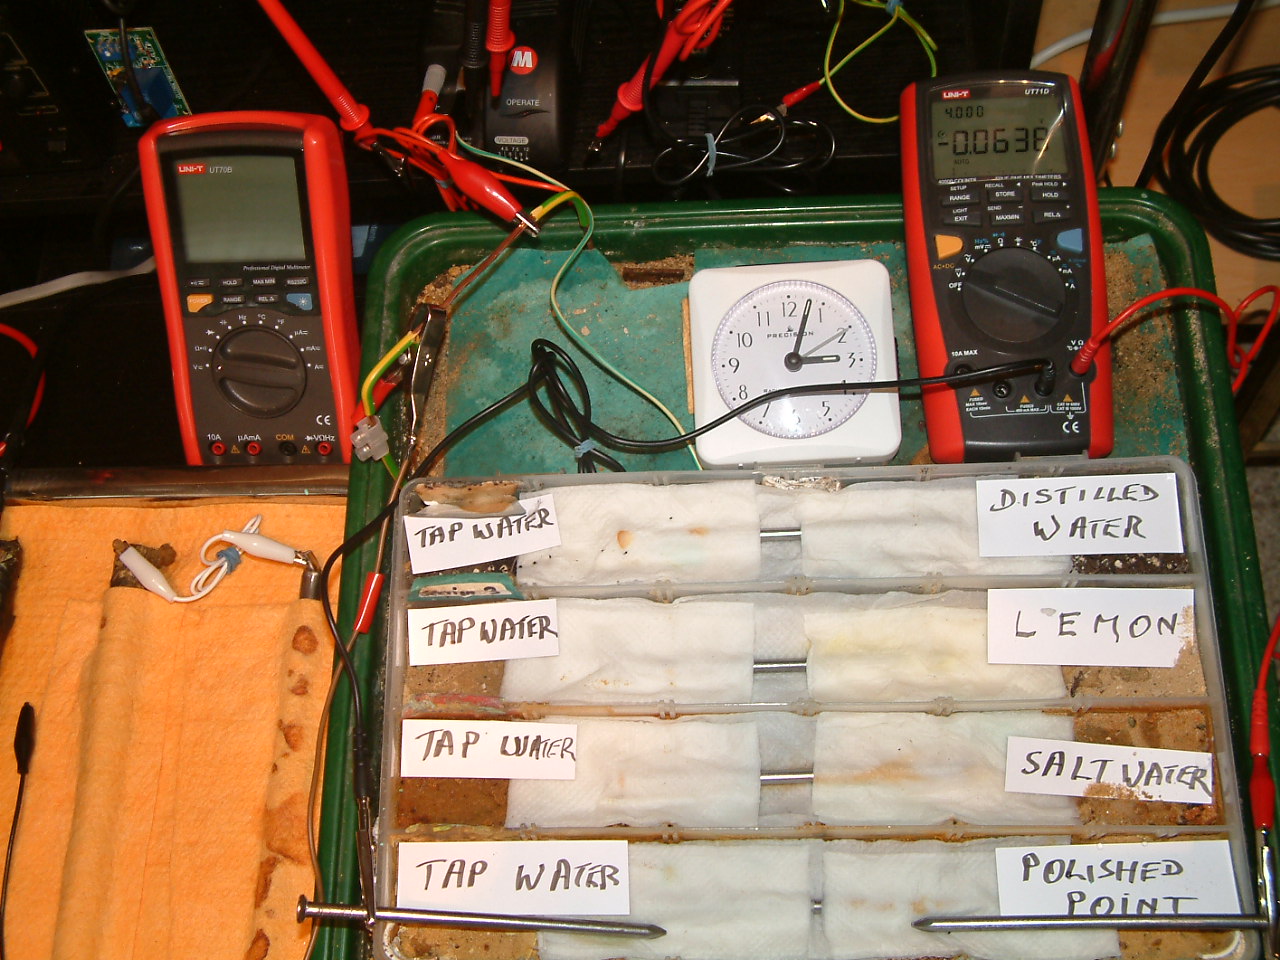
The next series of experiments uses four nails placed in a tray with insulated divisions.
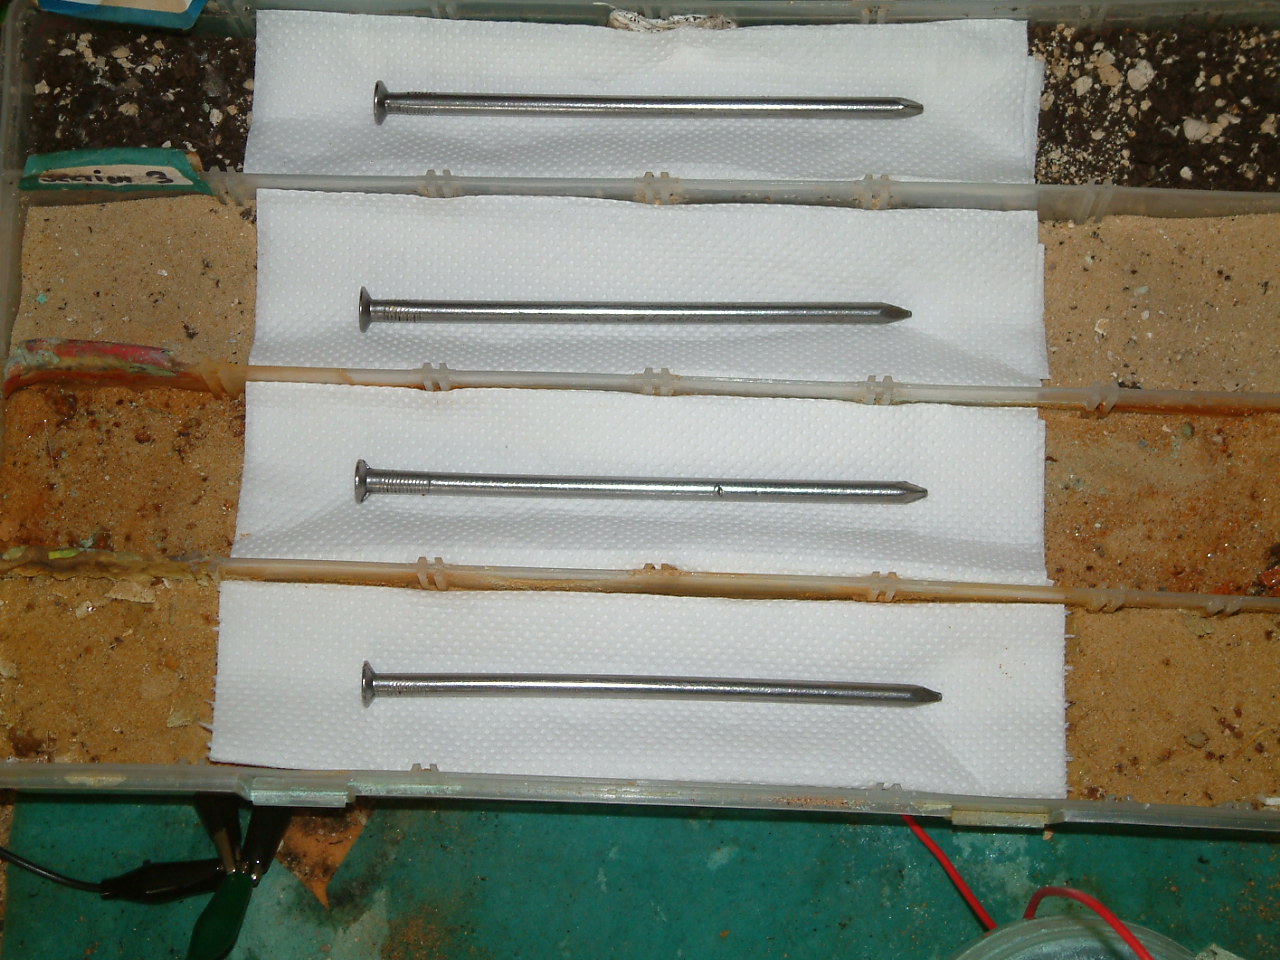
They are identical metal but the sections in which they are placed have different content. They are placed on paper to make it easy to see the corrosion products.

This series shows the electrical data that can be gathered with a high resistance voltmeter and the clock is there to provide a time scale for the corrosion processes.
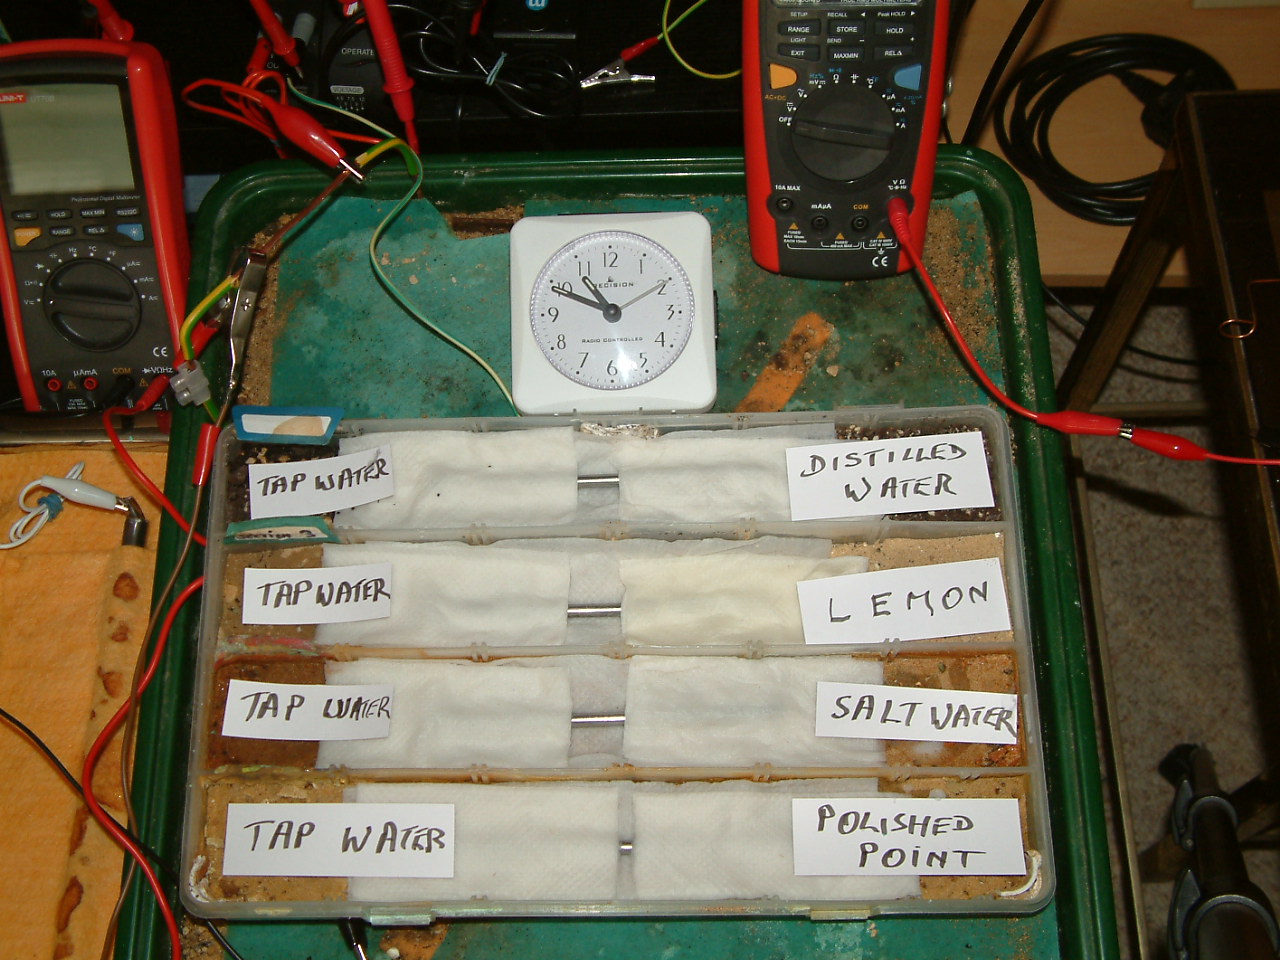
Tap water is poured over the left hand side of each partition and the left hand end of each nail is covered with a tap water soaked paper tissue. The ractions started at 10:49 hrs.
The right hand end of the partiions and paper are soaked as labelled. The nail in the front partition has been polished at the right hand end to show that polished steel will corrode anodically to the unpolished end. Two additional identical nails are used as probesfor making the measurements so that we do not have extra galvanic action with the variety of electrolytes.
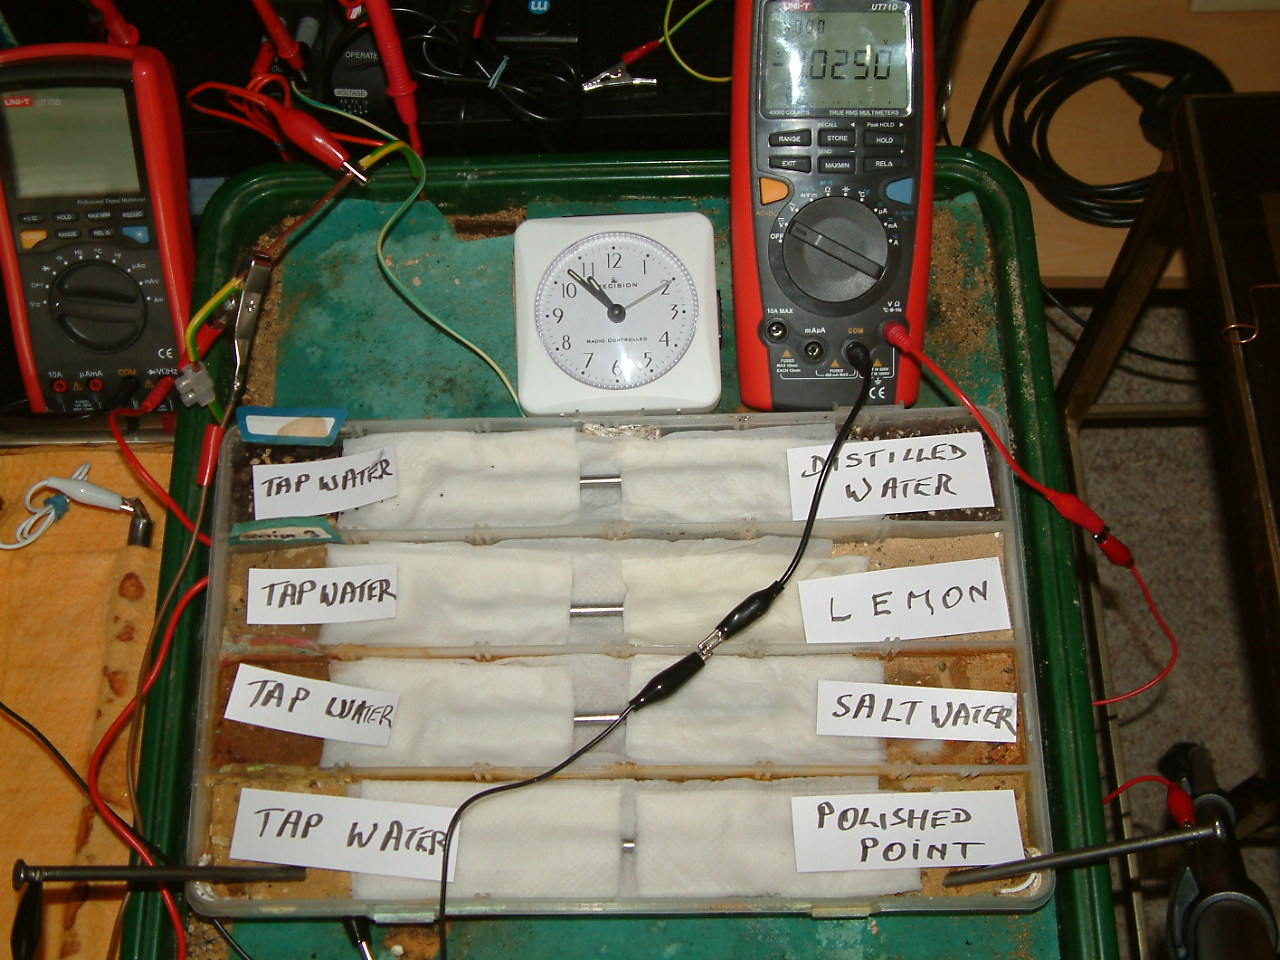
At 10:53 the first voltage was noted in the first partition -0.0250mv
The black lead of the meter is connected to the common and the meter make this zero for the purposes of the displayed values.
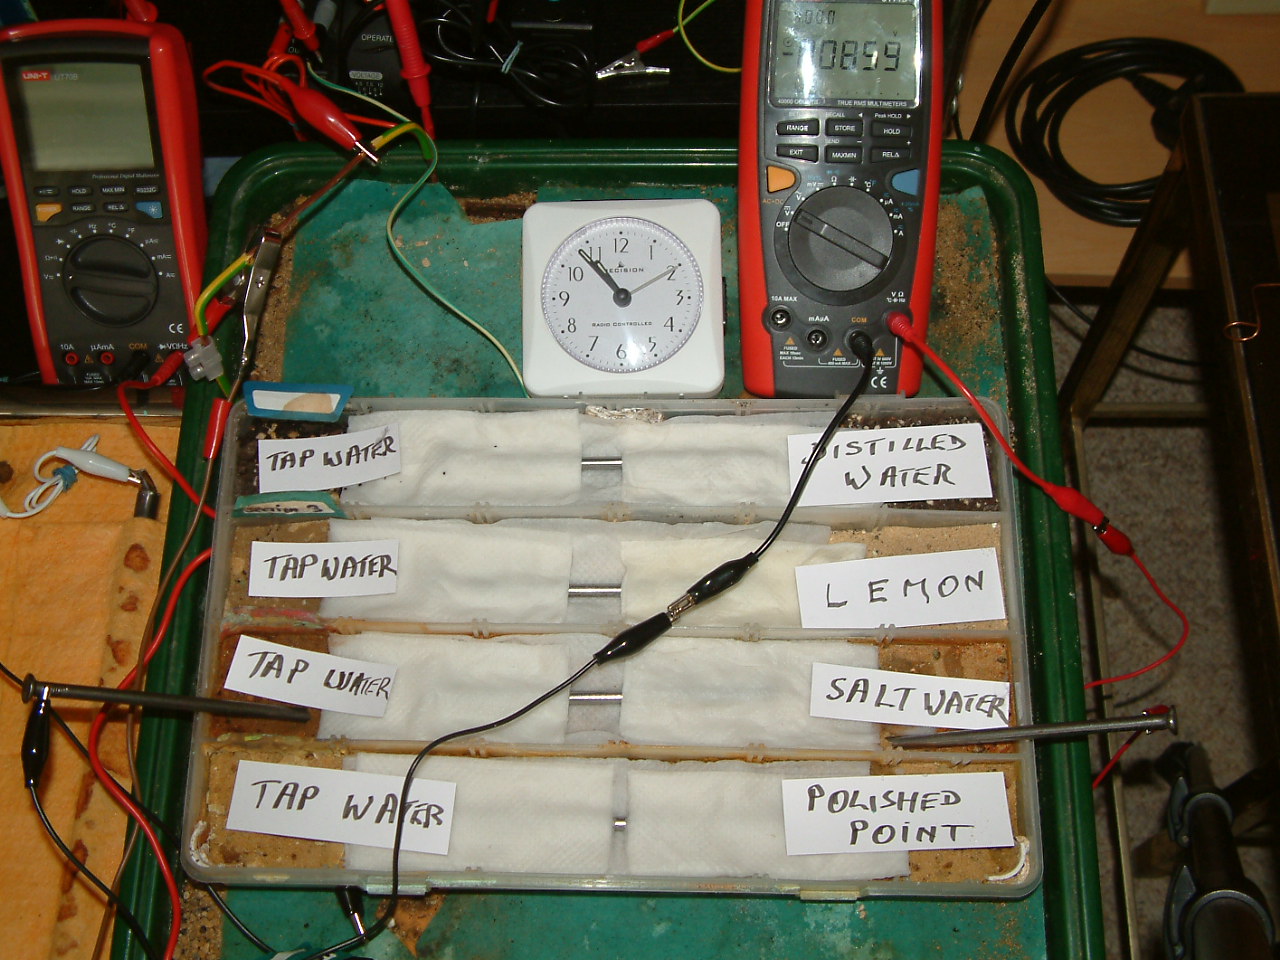
At 10:54 the voltage was noted in the second partition -0.0859mv
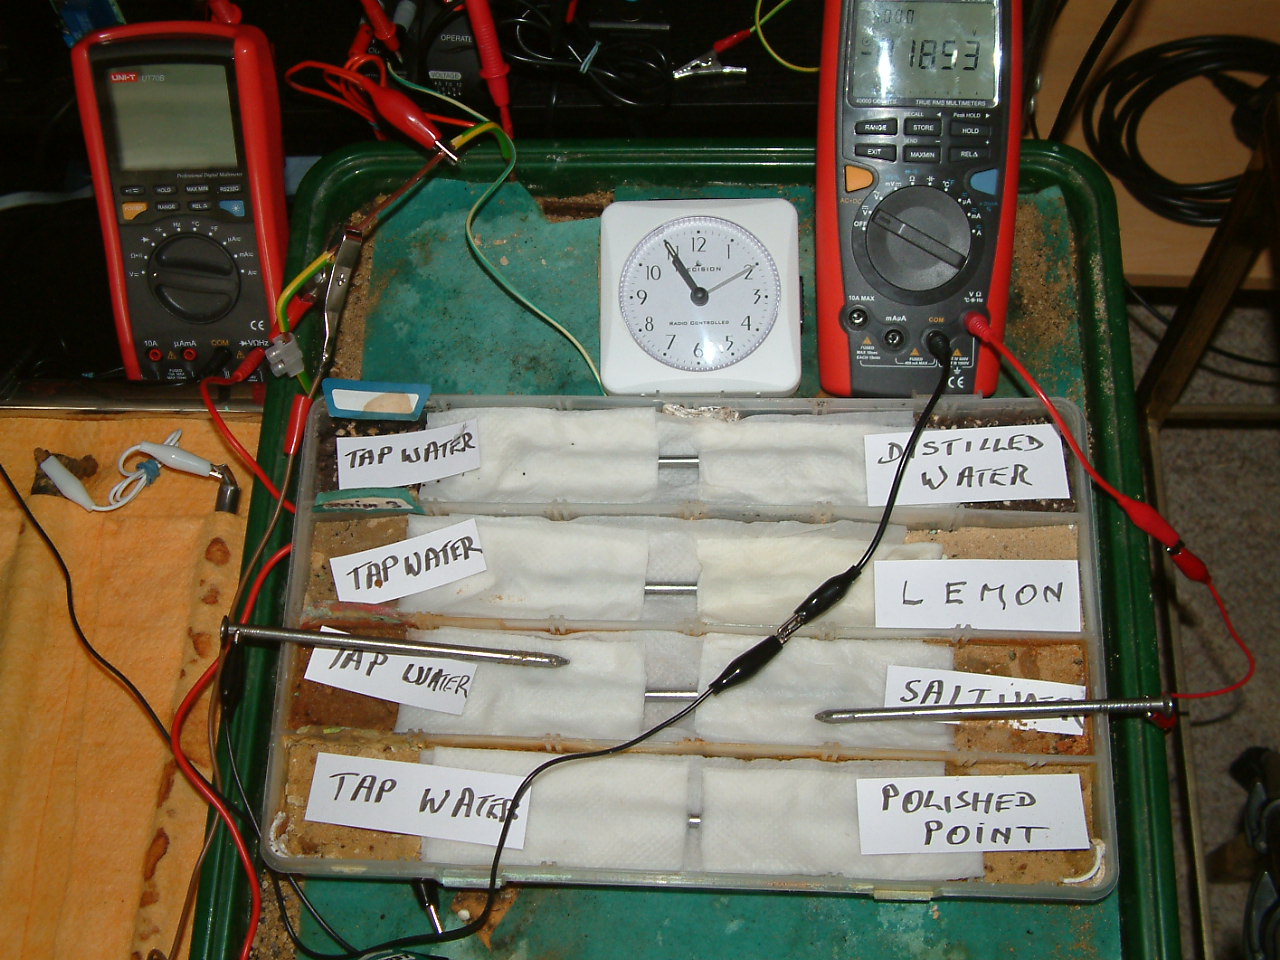
It will be seen that the left hand side of the partitions of electrolyte have less charges than the right hand side and the meter displays a negative value.
At 10:55 the voltage was noted in the third partition -0.1370mv
This is because the metal disolving discharges energy into the electrolyte and we would expect to see corrosion products at these anodes.
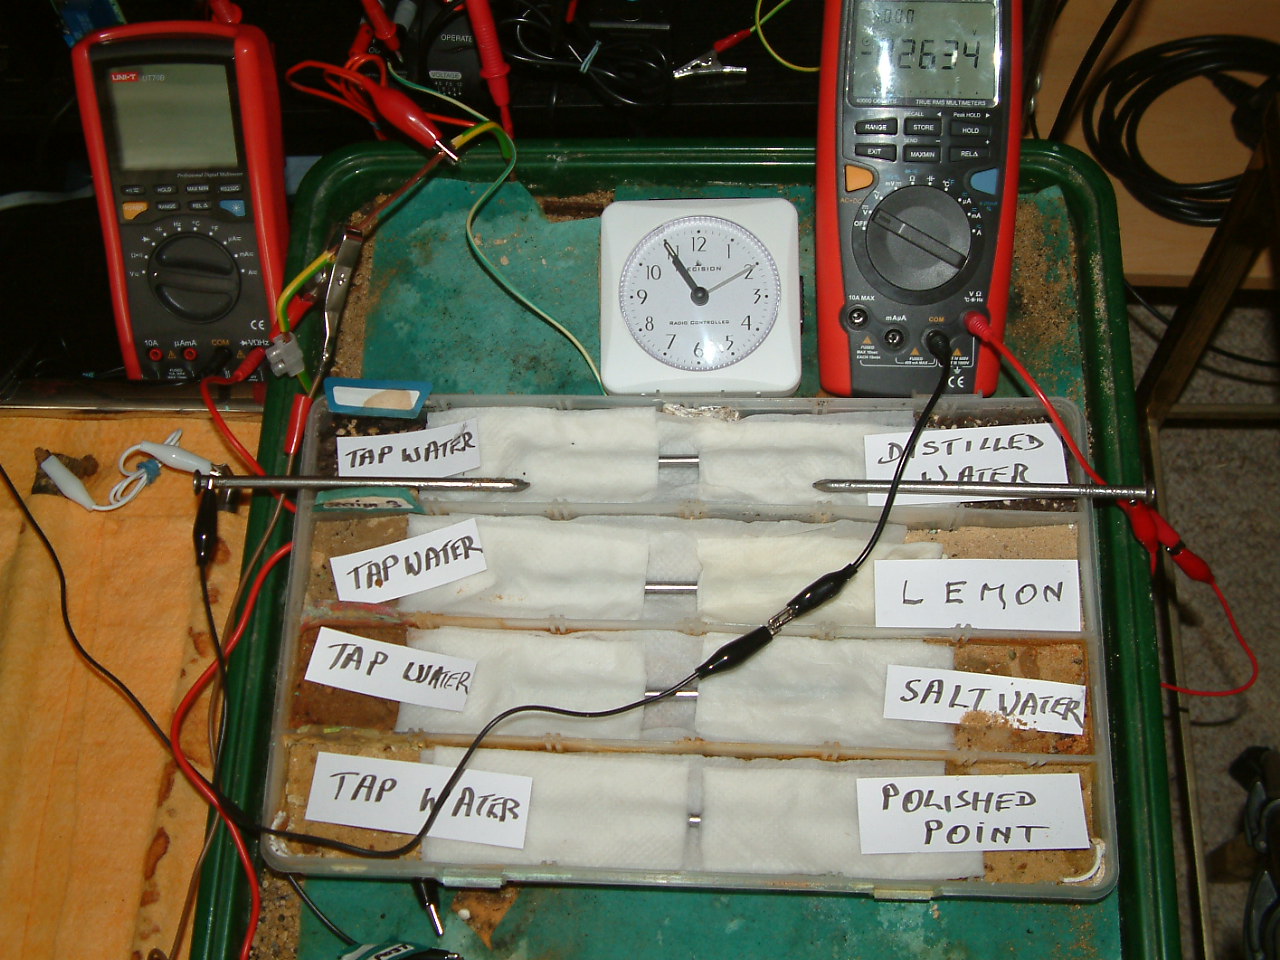
At 10:55 the voltage was noted in the fourth partition -0.2634mv
The meter is set to measure DC mv
At 10:55 the voltage was noted in the second partition -0.1853mv

At 10:55 the voltage was noted in the first partition -0.1058mv
At 11:55 the voltage was noted in the fourth partition -0.1958mv
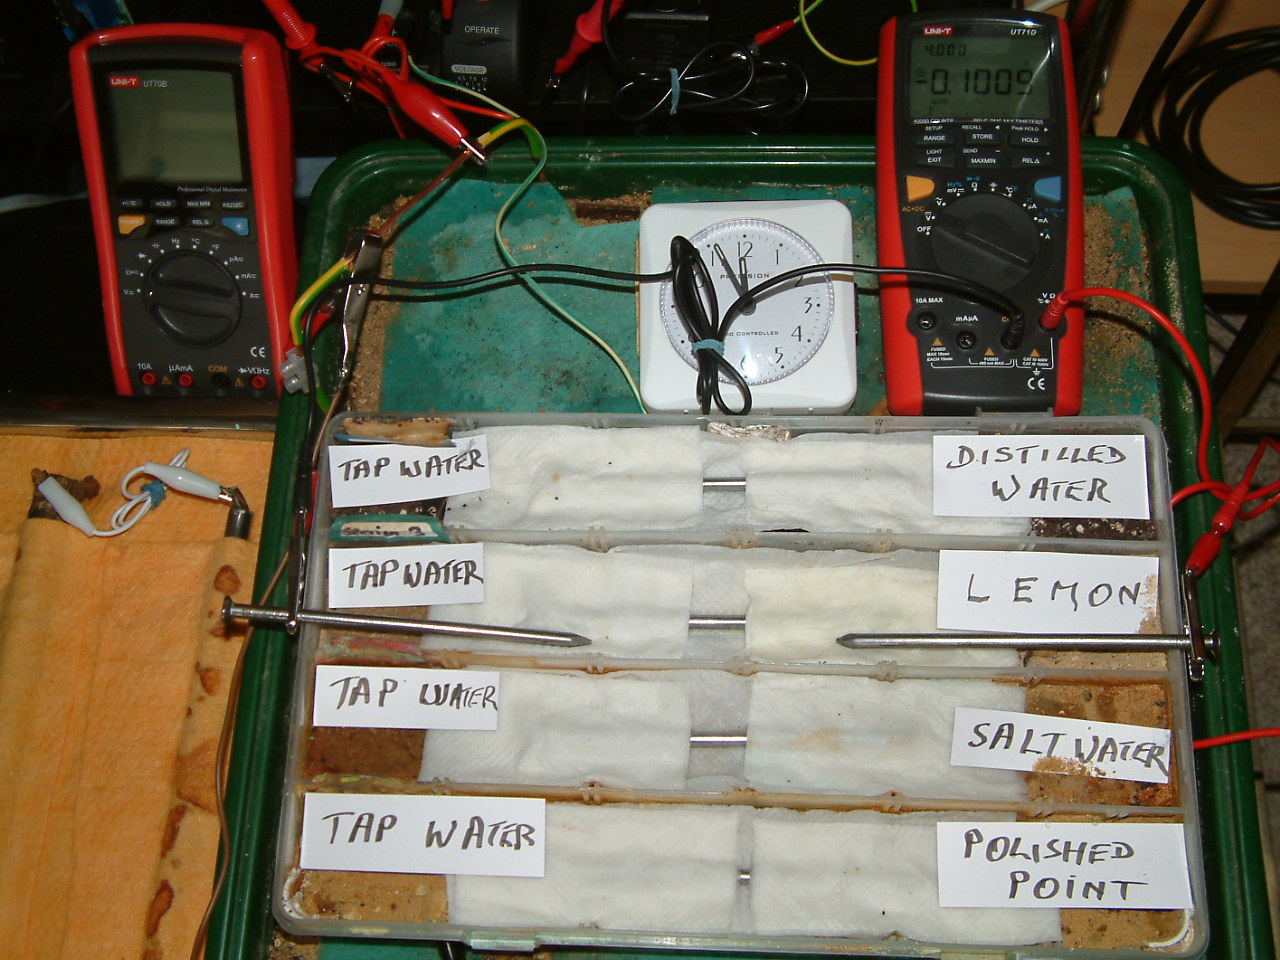
At 11:56 the voltage was noted in the third partition -0.1005mv

At 11:57 the voltage was noted in the second partition -0.2063mv

At 11:57 the voltage was noted in the first partition -0.1947mv
The charges resulting from distilled water are now less than those resulting from tap water.
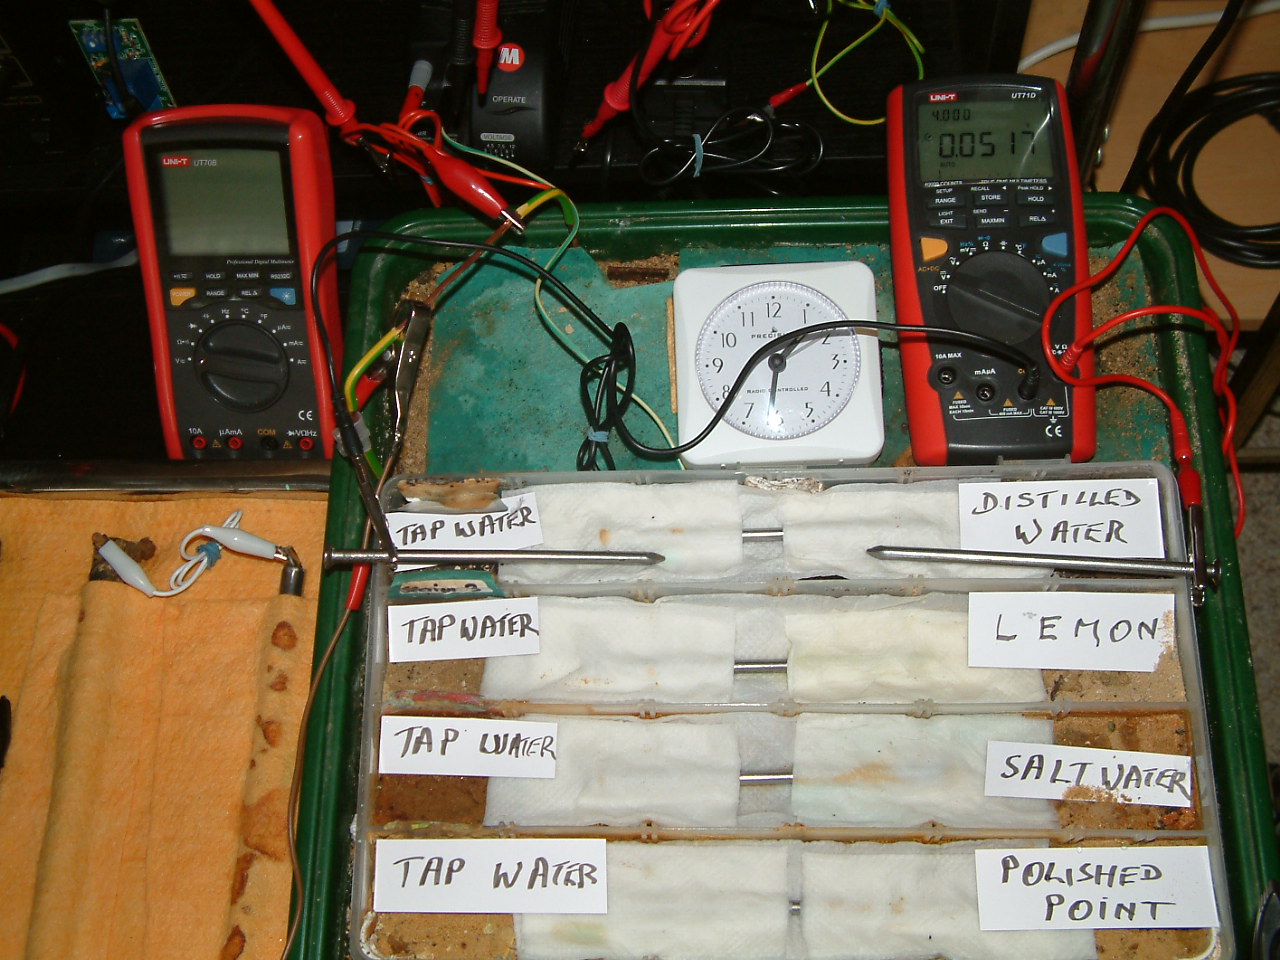
At 13:31 the voltage was noted in the fourth partition 0.0517mv
The charges resulting from distilled water are decreasing in relation to those resulting from tap water.
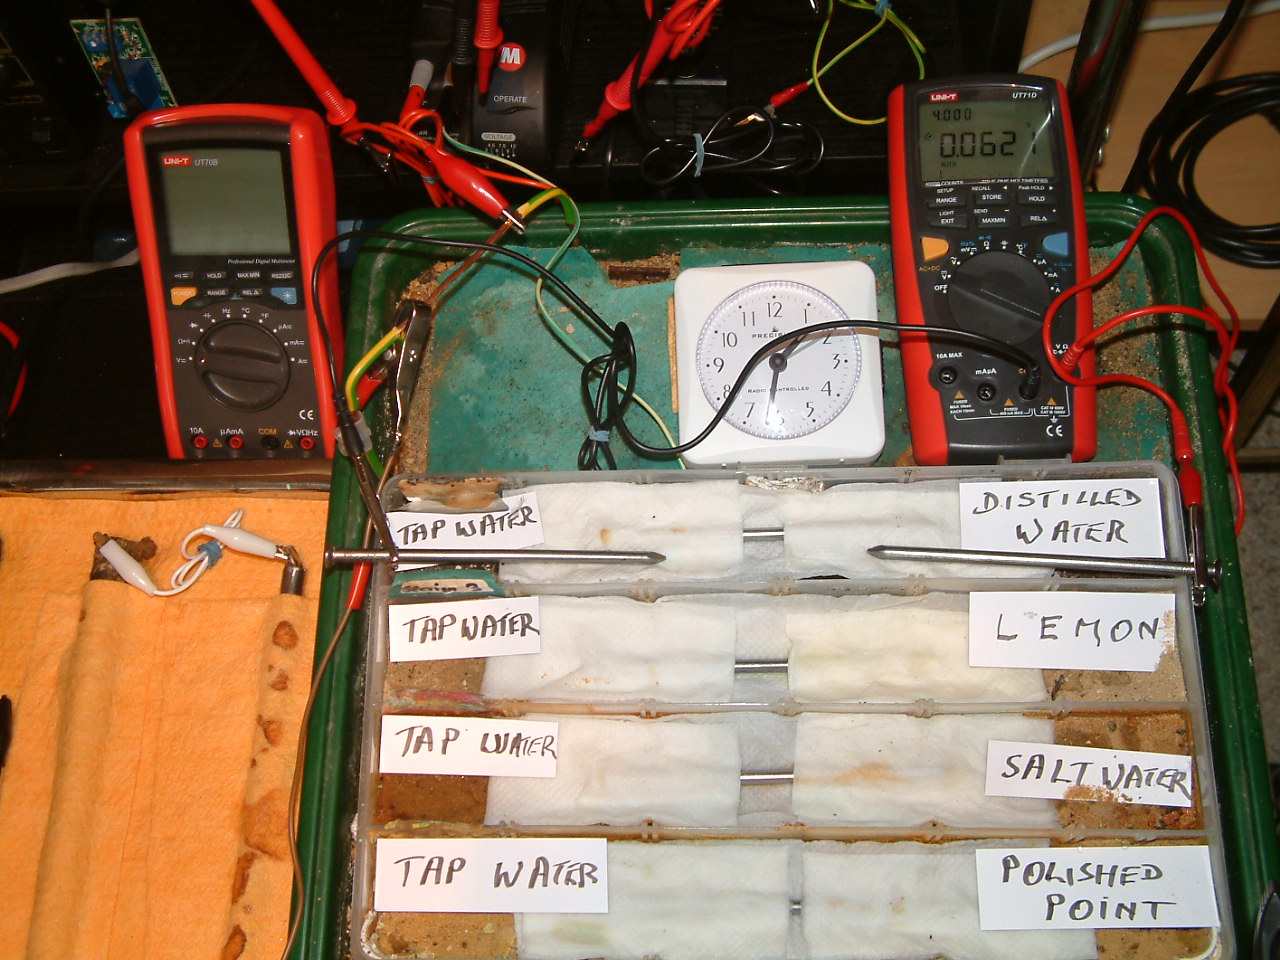
At 13:32 the voltage was noted in the fourth partition 0.0621mv

The charges resulting from lemon juice are increasing in relation to those resulting from tap water.
At 13:32 the voltage was noted in the third partition -0.1205mv
The charges resulting from salt water are increasing in relation to those resulting from tap water.
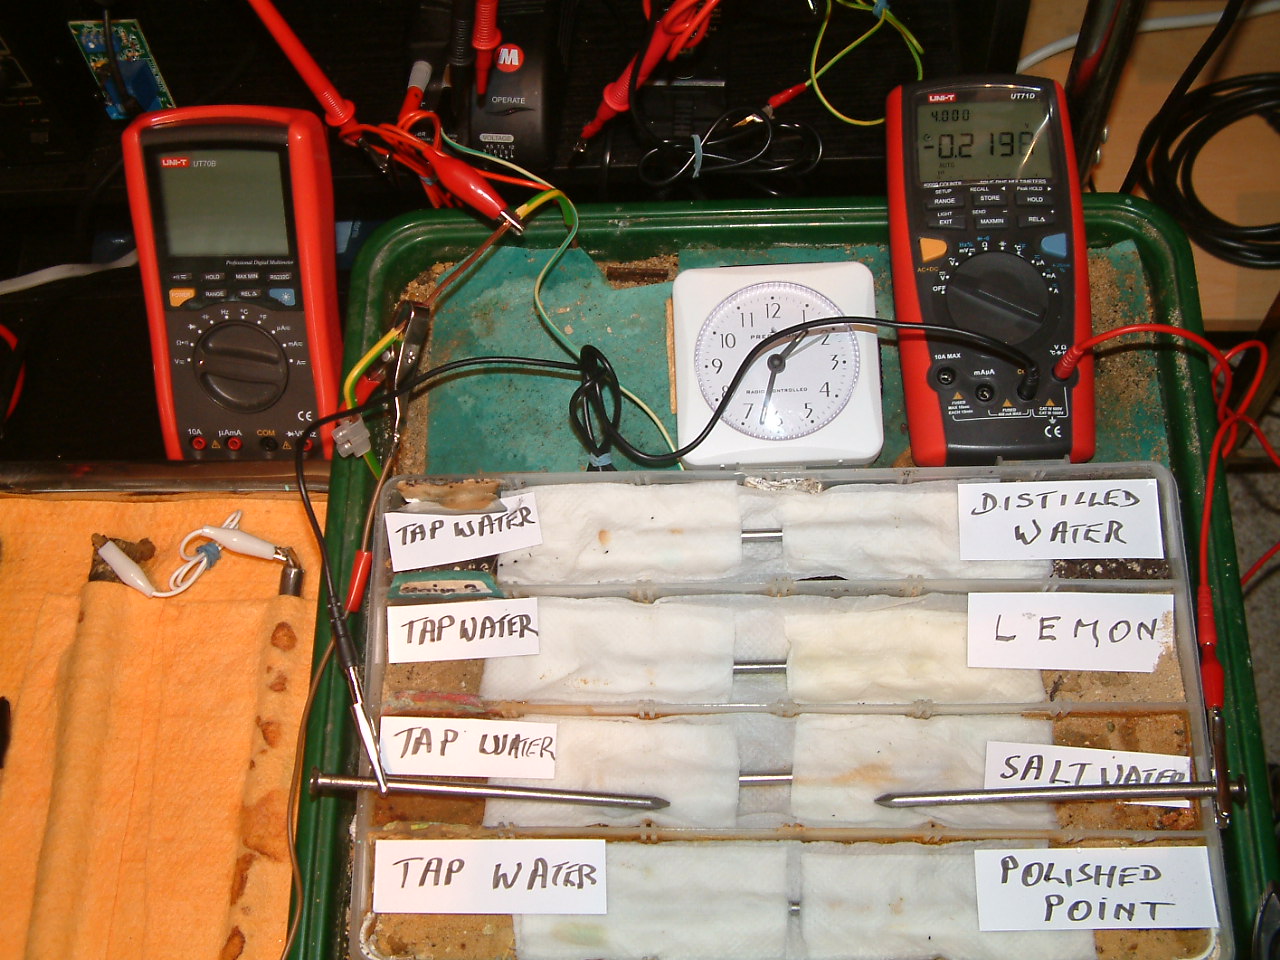
At 13:32 the voltage was noted in the second partition -0.2198mv

The charges resulting from polishing of the nail are increasing in relation to those resulting from tap water.
At 13:33 the voltage was noted in the first partition -0.2198mv
The charges resulting from distilled water are decreasing in relation to those resulting from tap water.
At 14:55 the voltage was noted in the fourth partition 0.2820mv
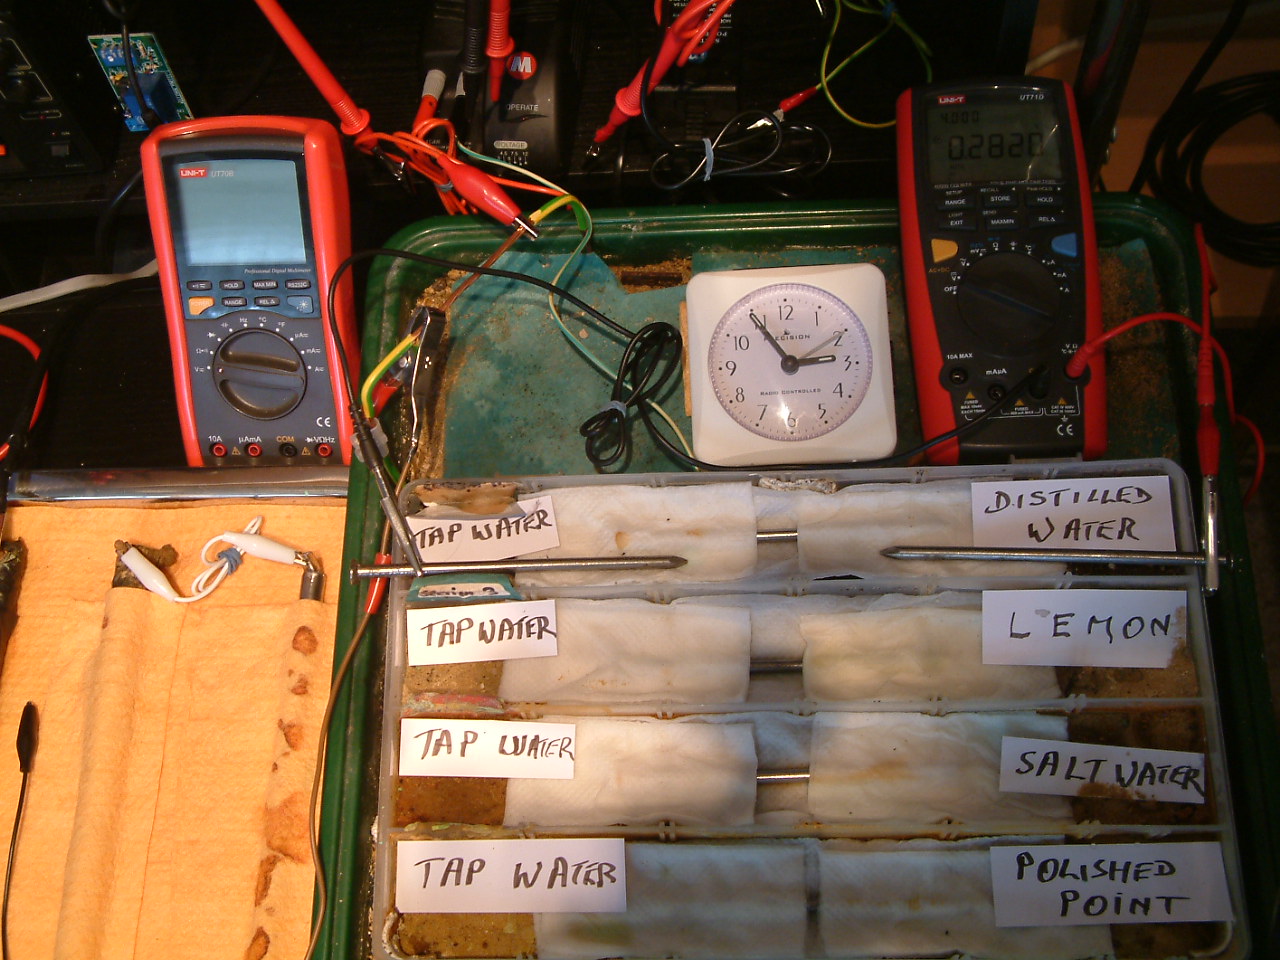
The charges resulting from distilled water are decreasing in relation to those resulting from tap water.
At 14:55 the voltage was noted in the fourth partition 0.2828mv

The charges resulting from lemon juice are increasing in relation to those resulting from tap water.
At 14:55 the voltage was noted in the third partition -0.1214mv
The charges resulting from salt water are increasing in relation to those resulting from tap water.
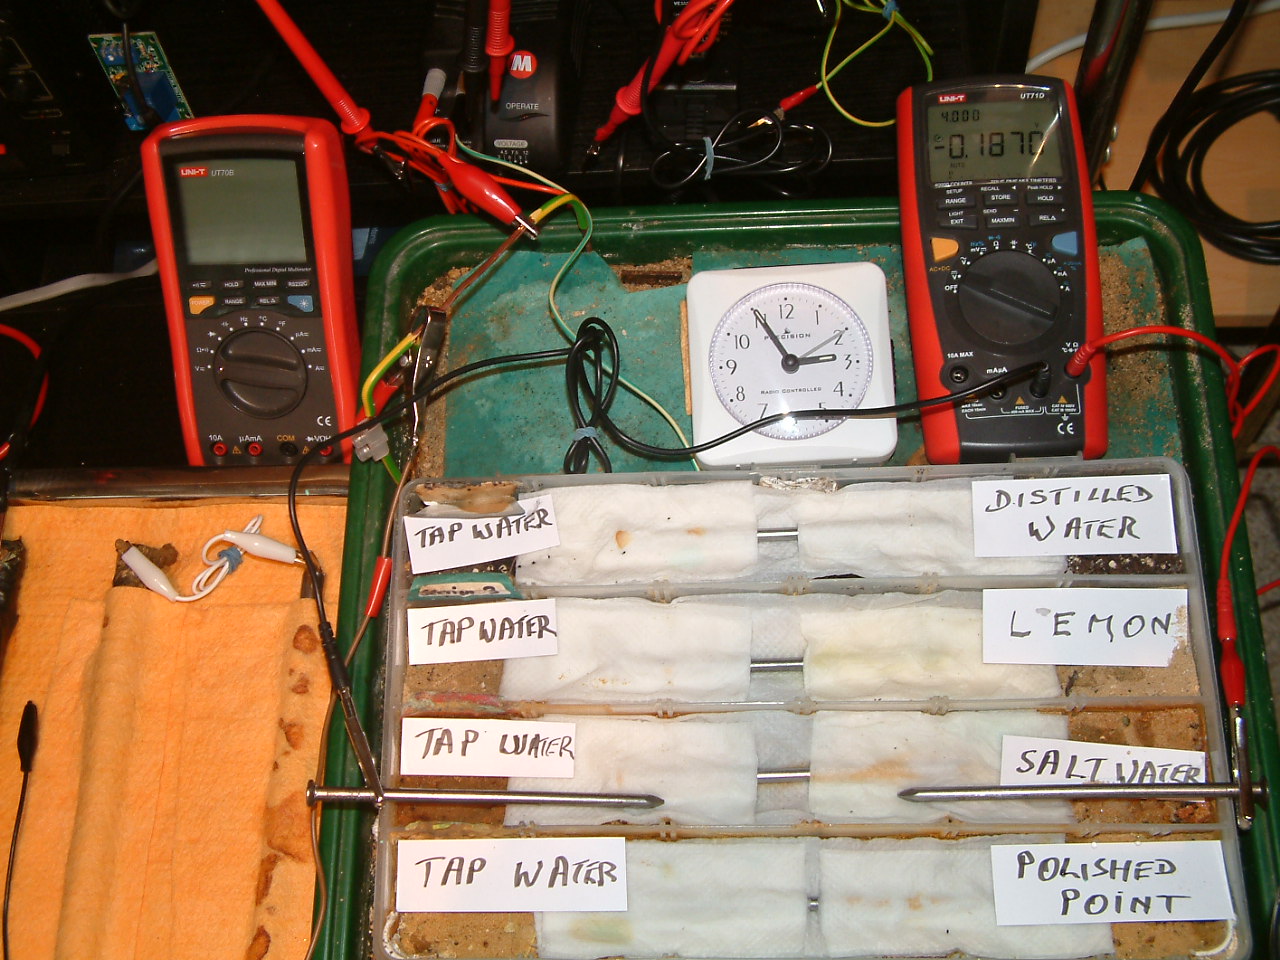
At 14:55 the voltage was noted in the third partition -0.1870mv

The charges resulting from polishing the nail are decreasing in relation to those resulting from tap water.
At 14:55 the voltage was noted in the first partition -0.0875mv

The charges resulting from polishing the nail are decreasing in relation to those resulting from tap water.
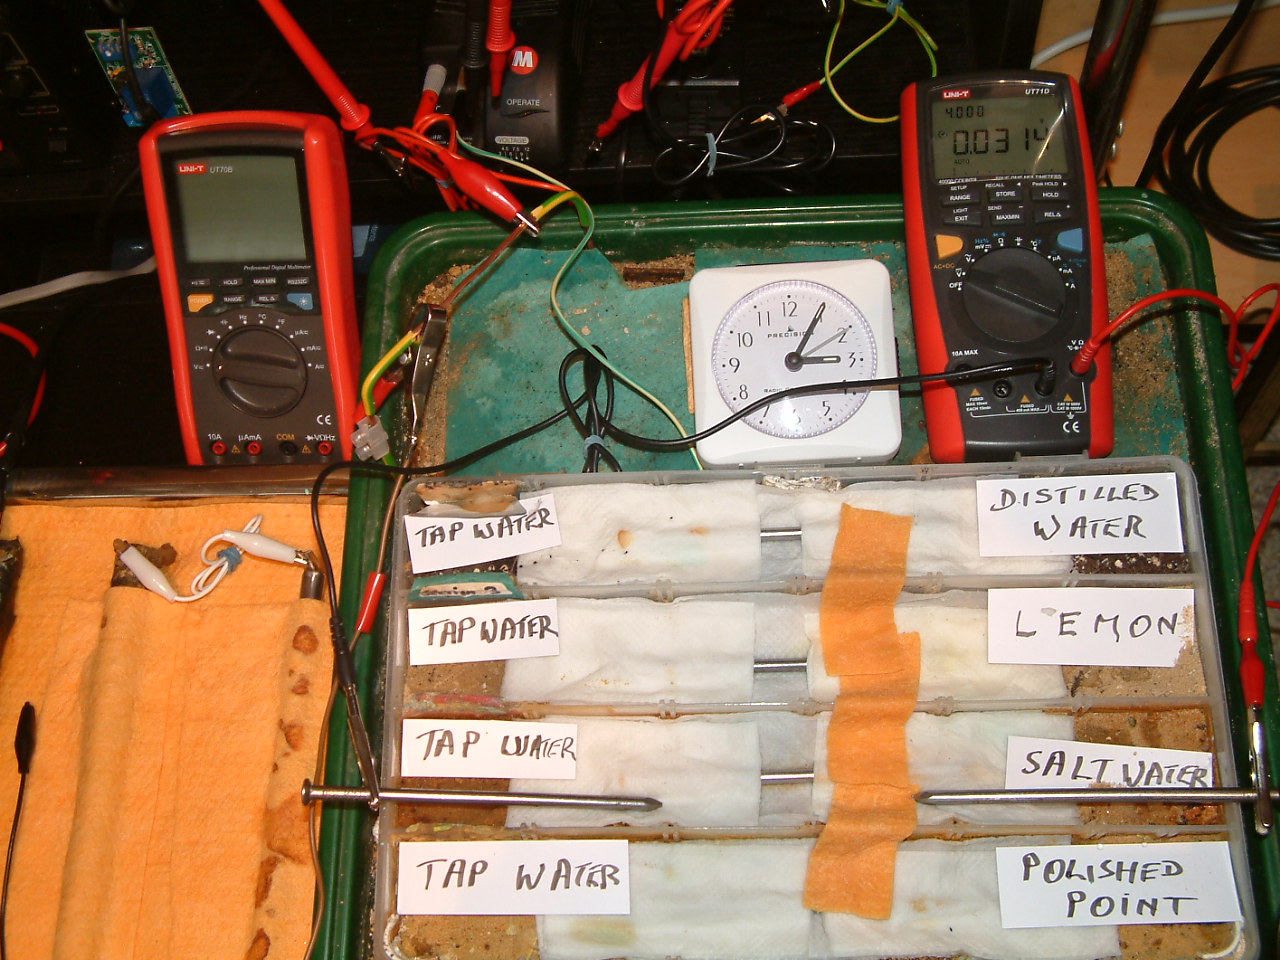
At 14:56 the voltage was noted in the first partition 0.0298mv

The charges resulting from the distilled water are decreasing in relation to those resulting from tap water.
At 14:58 the voltage was noted in the fourth partition 0.1455mv

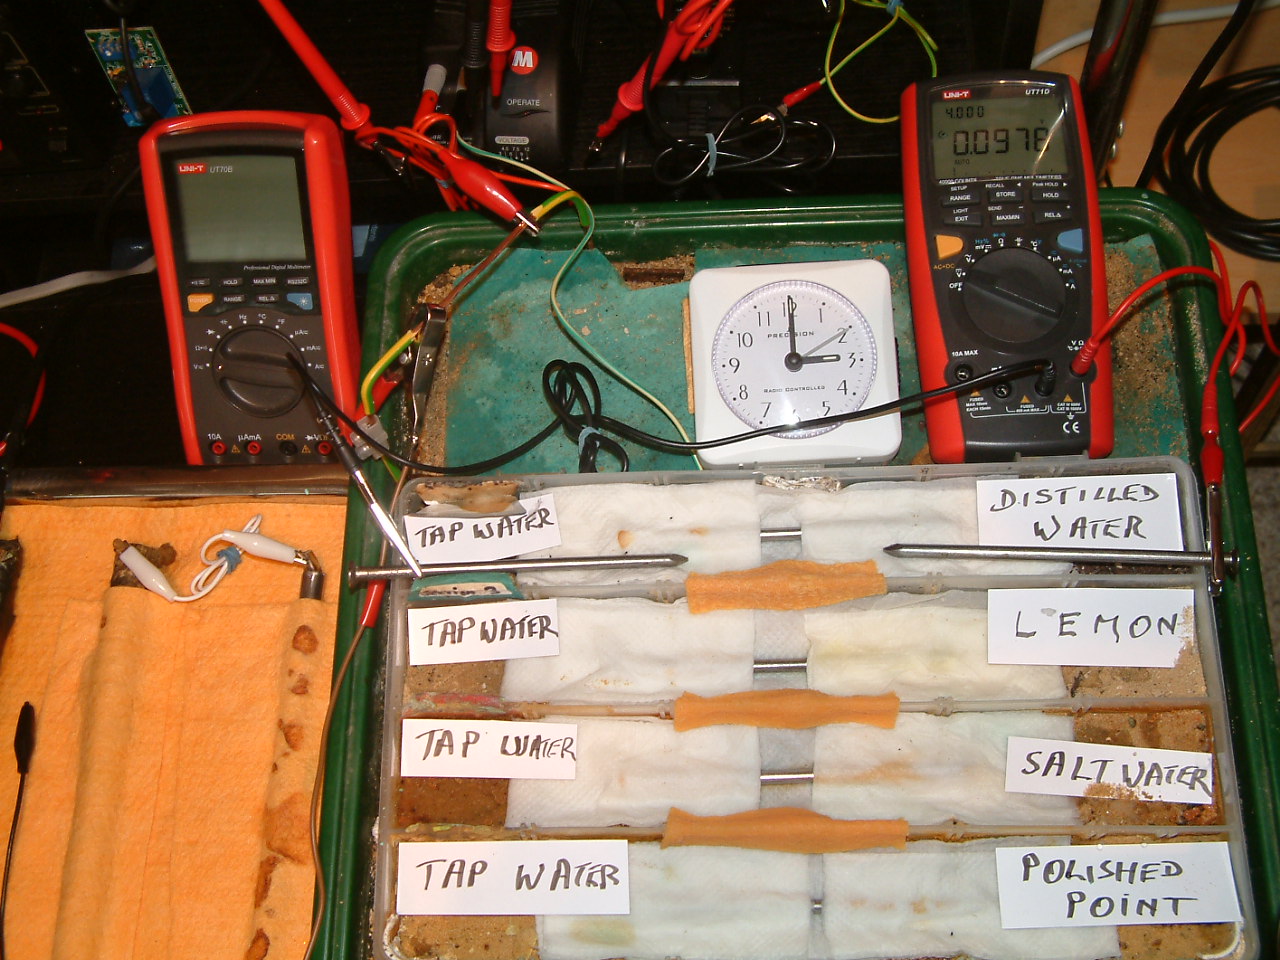
An electrolyte 'bridge was placed between particion three and four allowing charges to equalise according to the resistances.
The charges measured in the area of the distilled water are seen to decrease in relation to those resulting from tap water.
At 14:59 the voltage was noted in the fourth partition 0.1328mv

Another electrolyte 'bridge was placed between particion three and two allowing charges to equalise according to the resistances.
The charges measured in the area of the distilled water are seen to decrease in relation to those resulting from tap water.
At 14:59 the voltage was noted in the fourth partition 0.1045mv
Another electrolyte 'bridge was placed between particion one and two allowing charges to equalise according to the resistances.
The charges measured in the area of the distilled water are seen to decrease in relation to those resulting from tap water.
At 15:00 the voltage was noted in the fourth partition 0.0976mv
The electrolyte 'bridge was removed between partition one and two cutting off the charges generated in partition 1.
The charges measured in the area of the distilled water are seen to increase in relation to those resulting from tap water.
At 15:00 the voltage was noted in the fourth partition 0.1010mv
The electrolyte 'bridge was removed between partition one and two cutting off the charges generated in partitions 1 and 2.
The charges measured in the area of the distilled water are seen to increase in relation to those resulting from tap water.
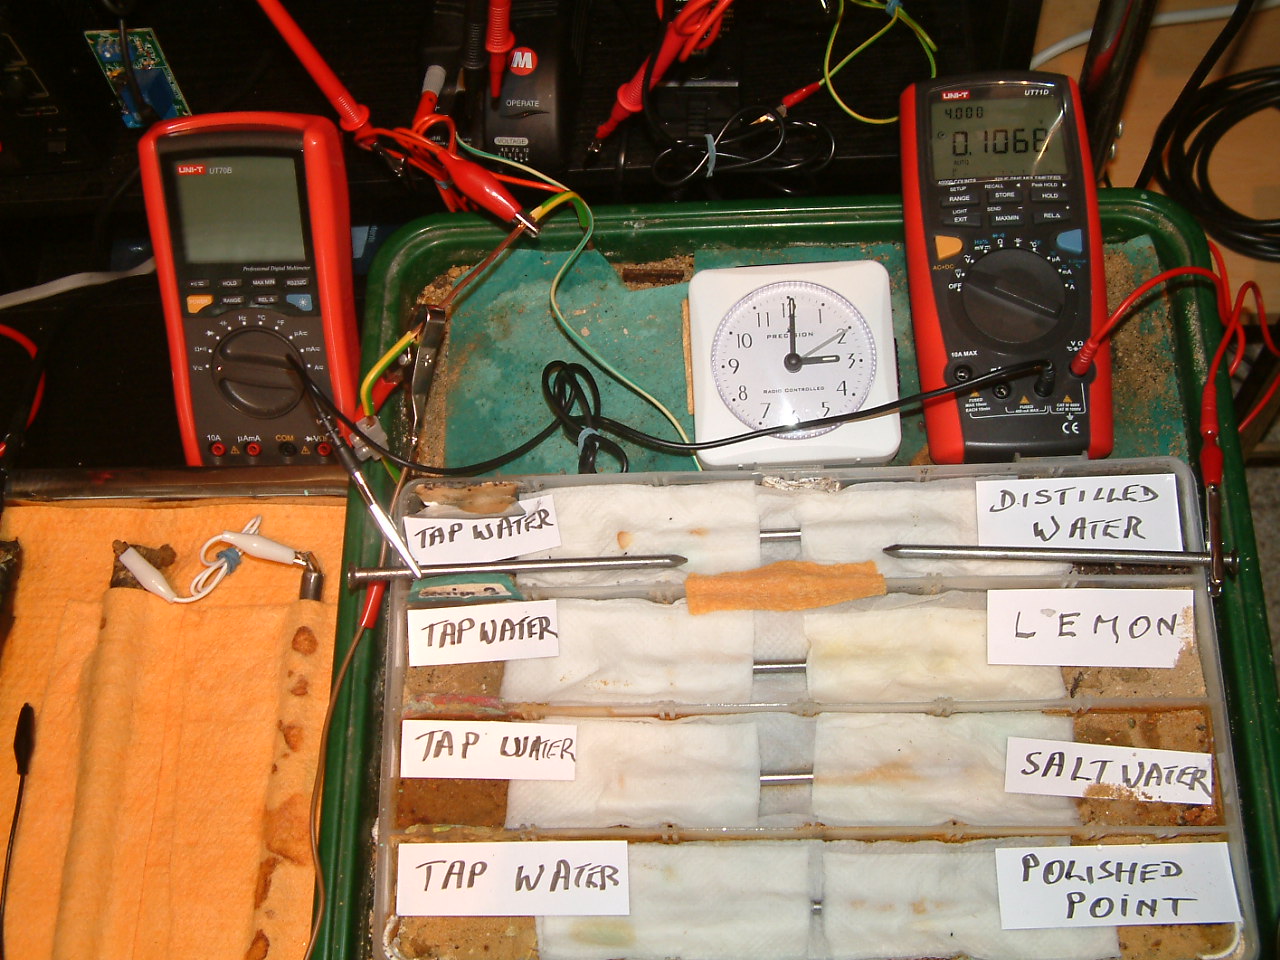
At 15:00 the voltage was noted in the fourth partition 0.1068mv

The electrolyte 'bridge was removed between partition one, two and three cutting off the charges generated in partitions 1, 2 and 3.
The charges measured in the area of the distilled water are seen to increase in relation to those resulting from tap water.
At 15:00 the voltage was noted in the fourth partition 0.1074mv

The 'probe nails' are moved to partition three'
At 15:01 hrs the potential difference between the lemon juice soaked area and the tap water is seen to be -0.1206mv
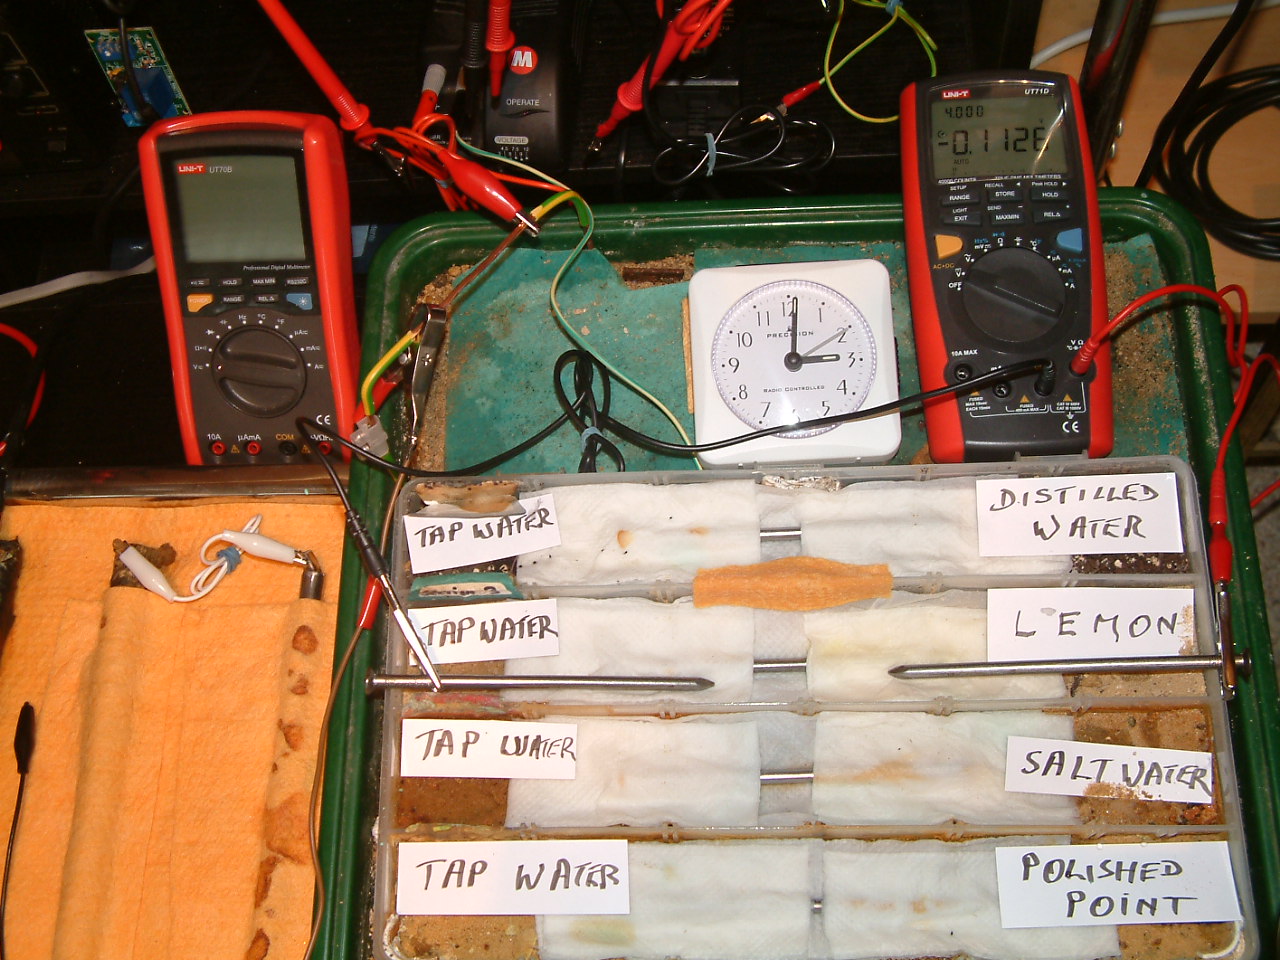
The 'probe nails' are still in partition three and the electrolyte bridge is replaced between partition three and four.
At 15:01 hrs the potential difference between the lemon juice soaked area and the tap water is seen to be -0.1126mv
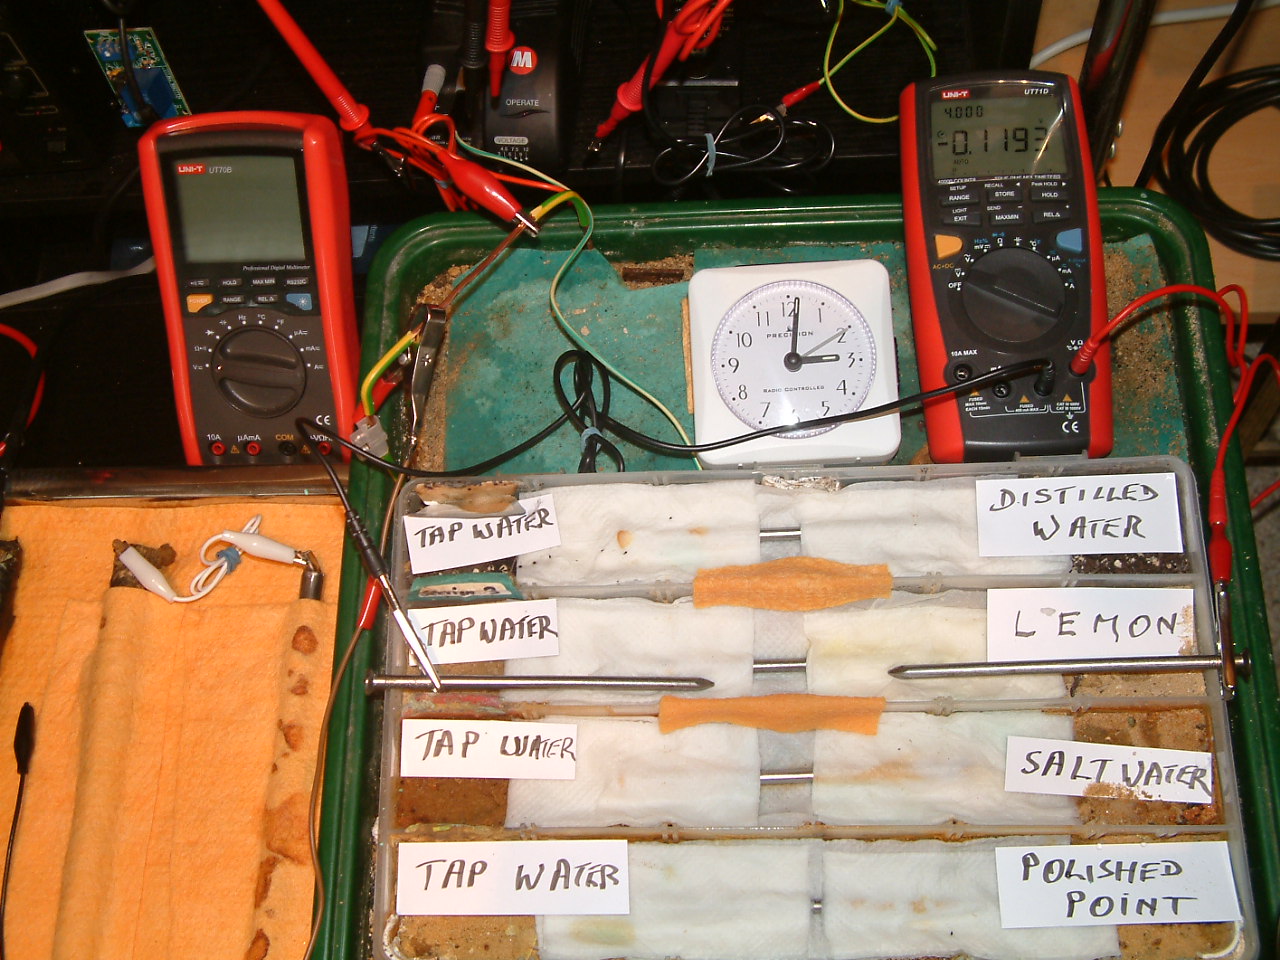
The 'probe nails' are still in partition three and the electrolyte bridge is replaced between partitions two, three and four.
At 15:01 hrs the potential difference between the lemon juice soaked area and the tap water is seen to be -0.1193mv

The 'probe nails' are still in partition three and the electrolyte bridge is replaced between partitions one, two, three and four.
At 15:02 hrs the potential difference between the lemon juice soaked area and the tap water is seen to be -0.1200mv
The 'probe nails' are now in partition two.
At 15:02 hrs the potential difference between the salt water area and the tap water is seen to be -0.1747mv
The 'probe nails' are now in partition two and the electrolyte bridge has been placed between partitions three and four..
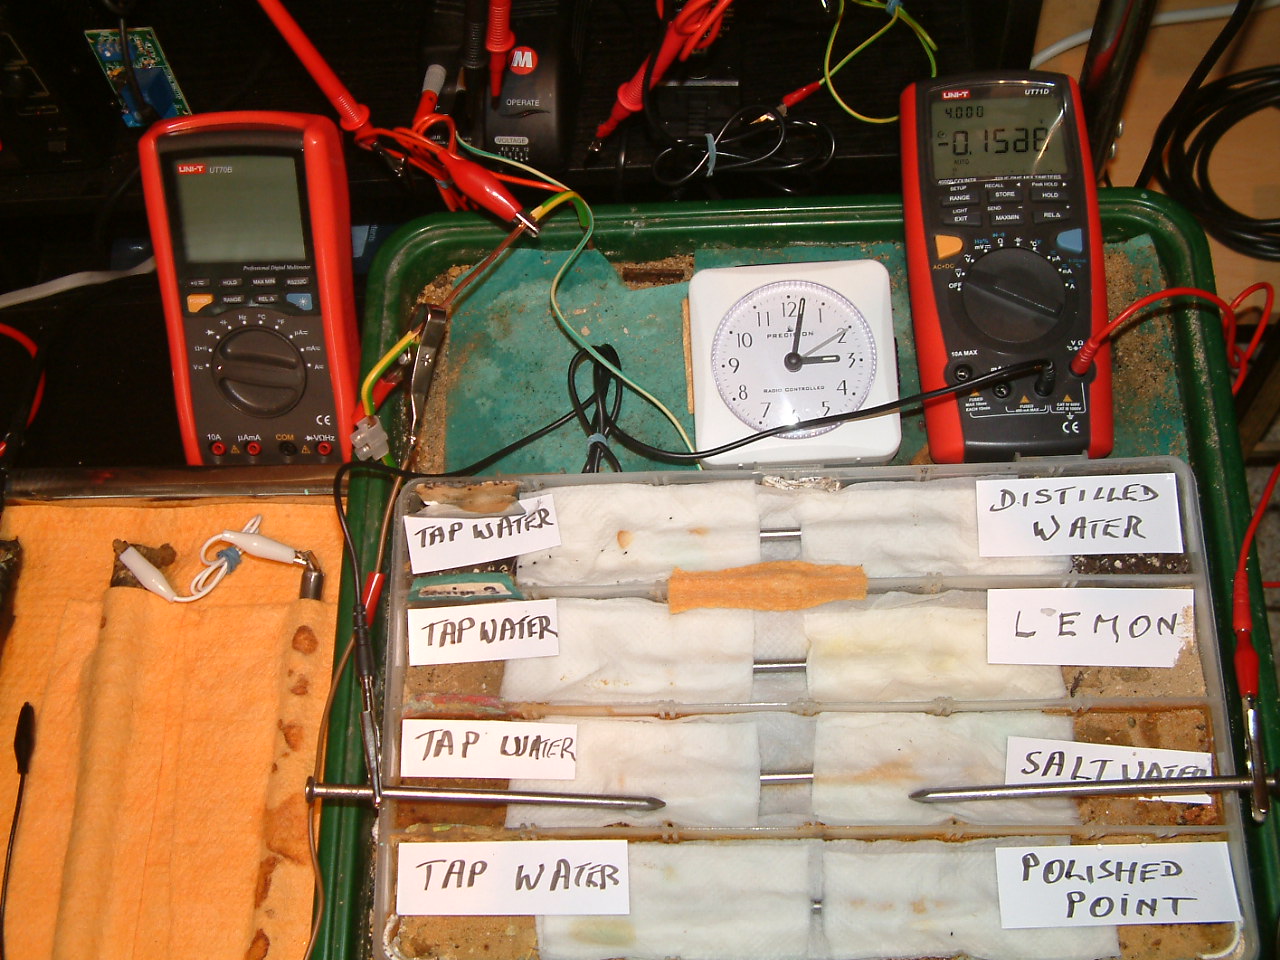
At 15:02 hrs the potential difference between the salt water area and the tap water is seen to be -0.1588mv
The 'probe nails' are now in partition two and the electrolyte bridge has been placed between partitions two, three and four..
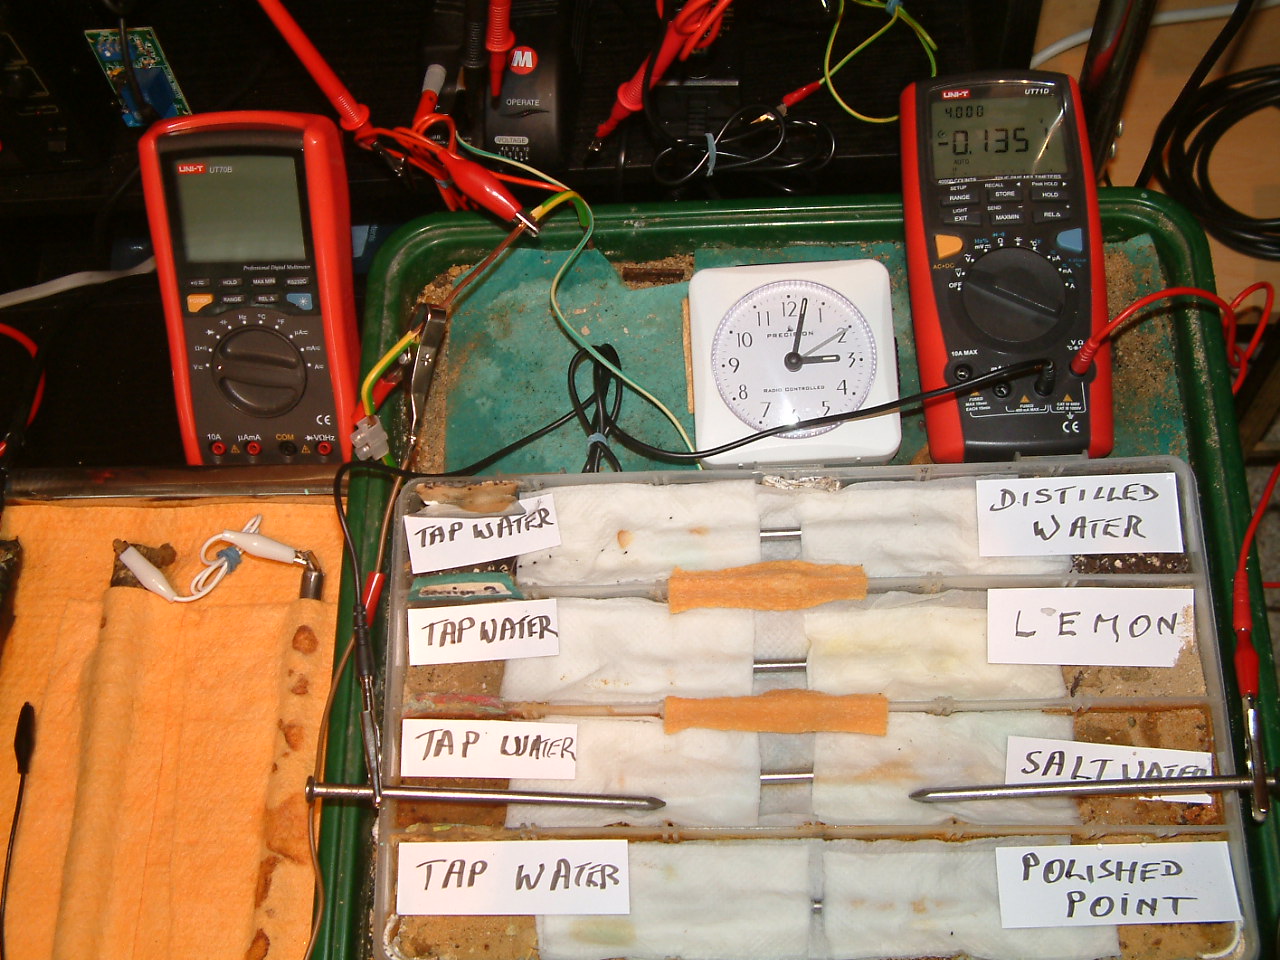
At 15:02 hrs the potential difference between the salt water area and the tap water is seen to be -0.1350mv
The 'probe nails' are now in partition two and the electrolyte bridge has been placed between partitions one, two, three and four..
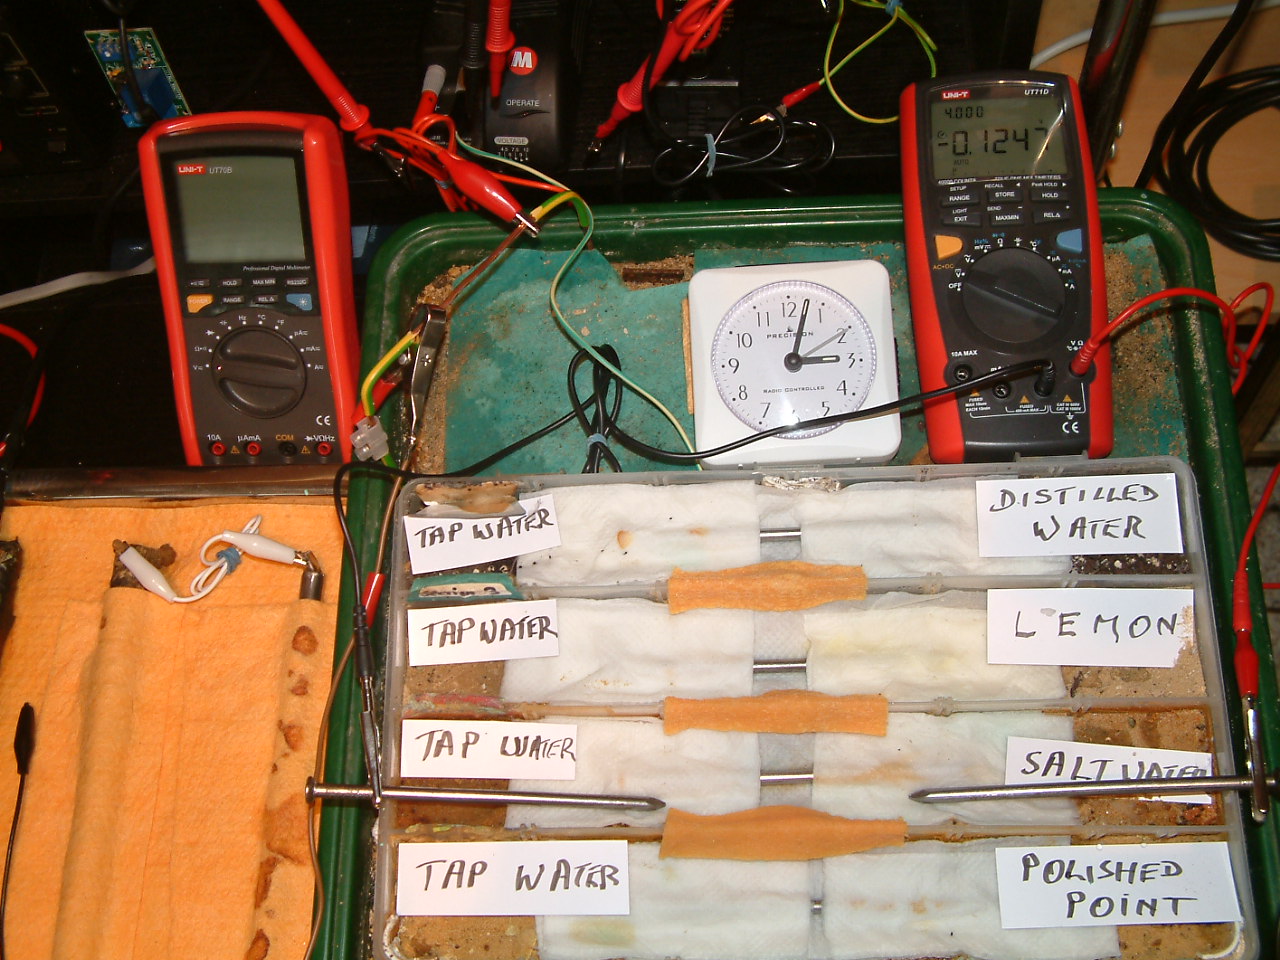
At 15:02 hrs the potential difference between the salt water area and the tap water is seen to be -0.1247mv
The 'probe nails' are now in partition one.
At 15:03 hrs the potential difference between the polished nail area and the tap water is seen to be -0.0638mv
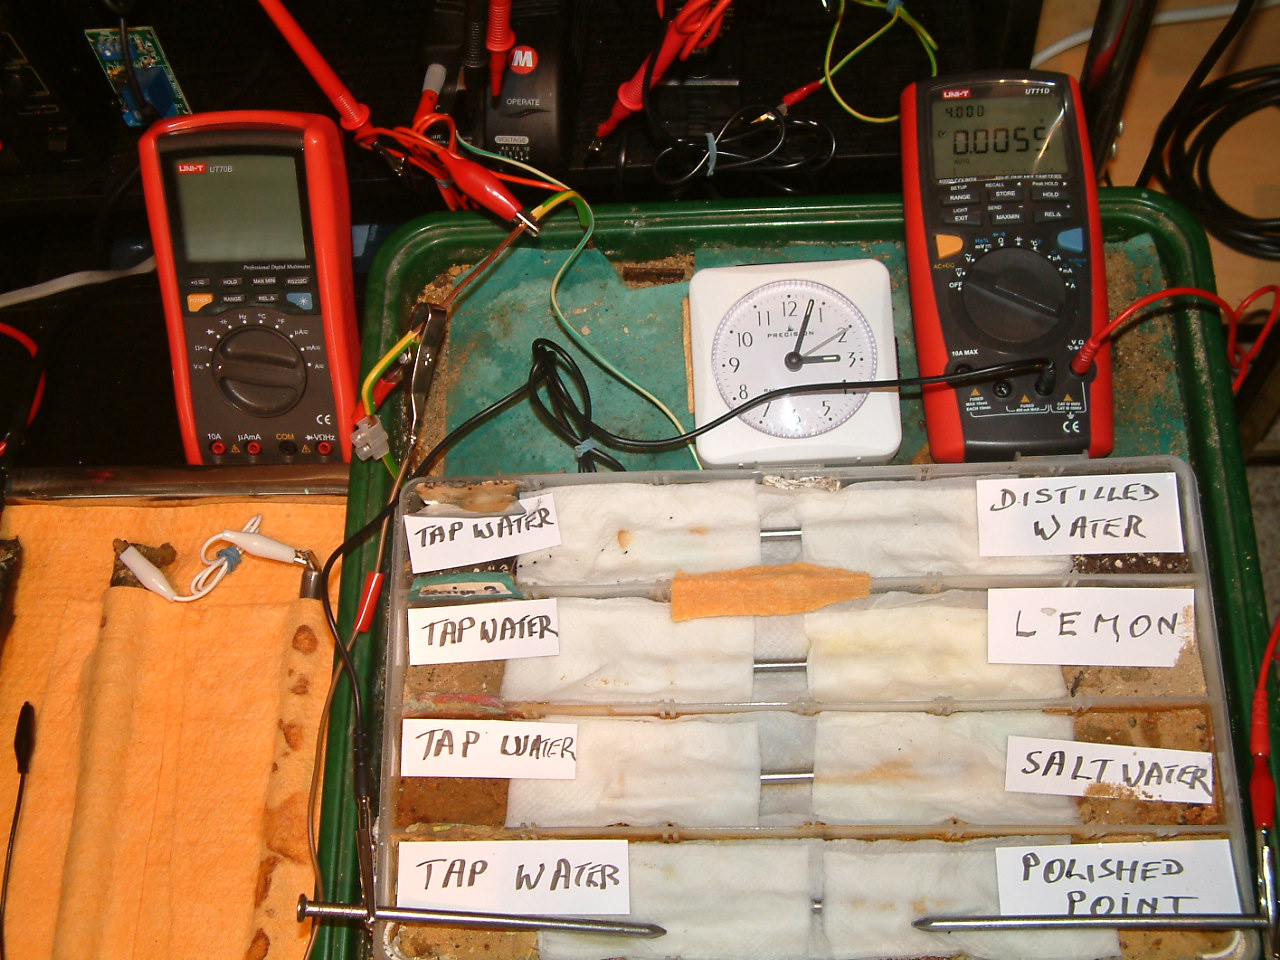
The 'probe nails' are now in partition one and the electrolyte bridge has been placed between partitions three and four..
At 15:03 hrs the potential difference between the polished nail area and the tap water is seen to be 0.0055mv
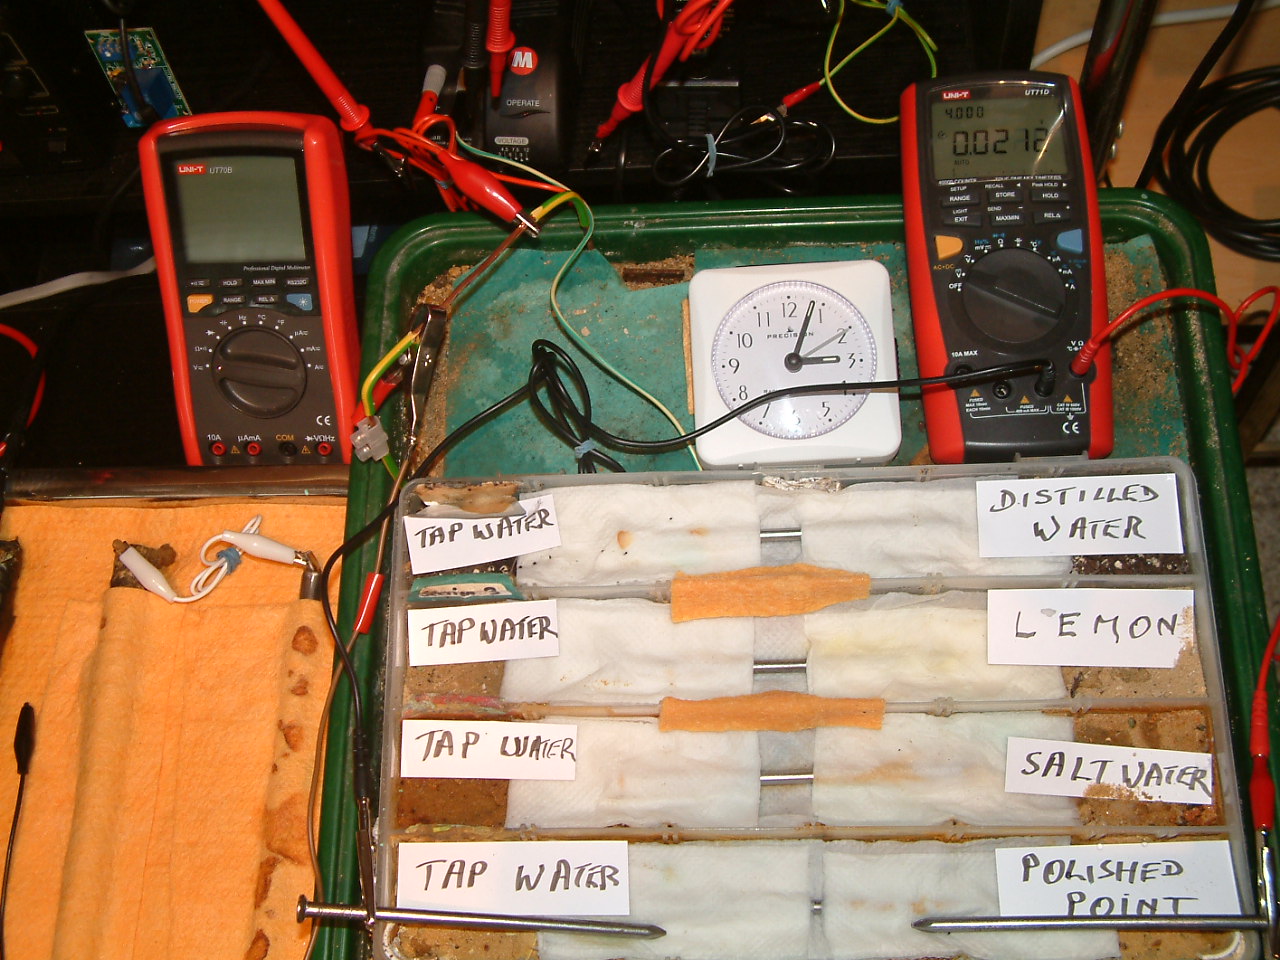
The 'probe nails' are now in partition one and the electrolyte bridge has been placed between partitions two, three and four..
At 15:04 hrs the potential difference between the polished nail area and the tap water is seen to be 0.0212mv

The 'probe nails' are now in partition one and the electrolyte bridge has been placed between partitions one, two, three and four..
At 15:04 hrs the potential difference between the polished nail area and the tap water is seen to be 0.0328mv

The 'probe nails' are now in partition one and the electrolyte bridges have been removed.
At 15:04 hrs the potential difference between the polished nail area and the tap water is seen to be 0.0568mv
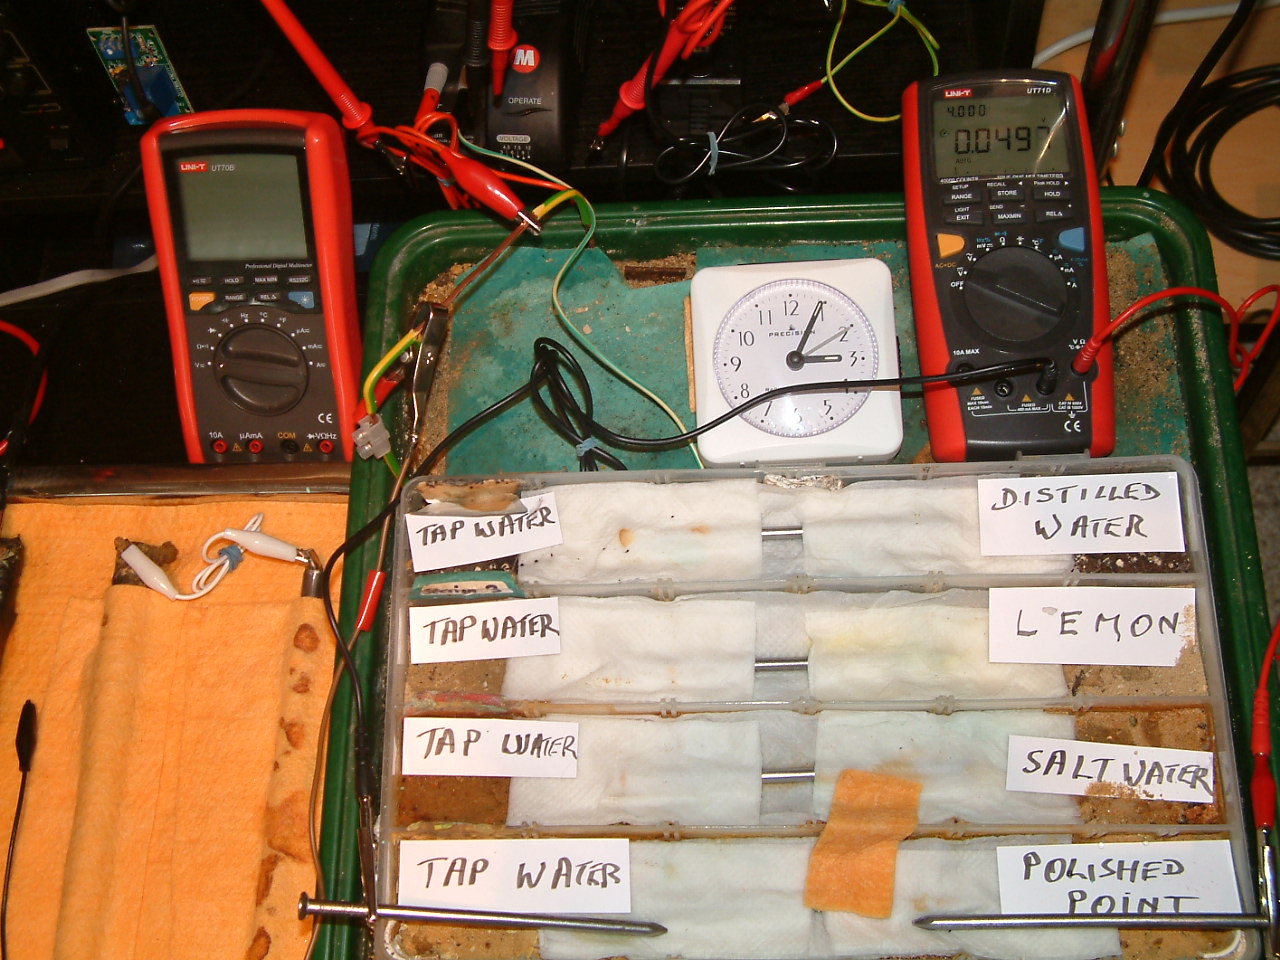
The 'probe nails' are now in partition one and an electrolyte bridge has been put across partition 0ne and two
At 15:05 hrs the potential difference between the polished nail area and the tap water is seen to be 0.0497mv

The 'probe nails' are now in partition one and an electrolyte bridge has been put across partition 0ne, two and three.
At 15:05 hrs the potential difference between the polished nail area and the tap water is seen to be 0.0513mv

The 'probe nails' are now in partition one and an electrolyte bridge has been put across partition 0ne, two, three and four.
At 15:05 hrs the potential difference between the polished nail area and the tap water is seen to be 0.0532mv
All partitions are bridged and the probe nails are now in partition two.
At 15:05 hrs the potential difference between the salt water area and the tap water is seen to be 0.0314mv
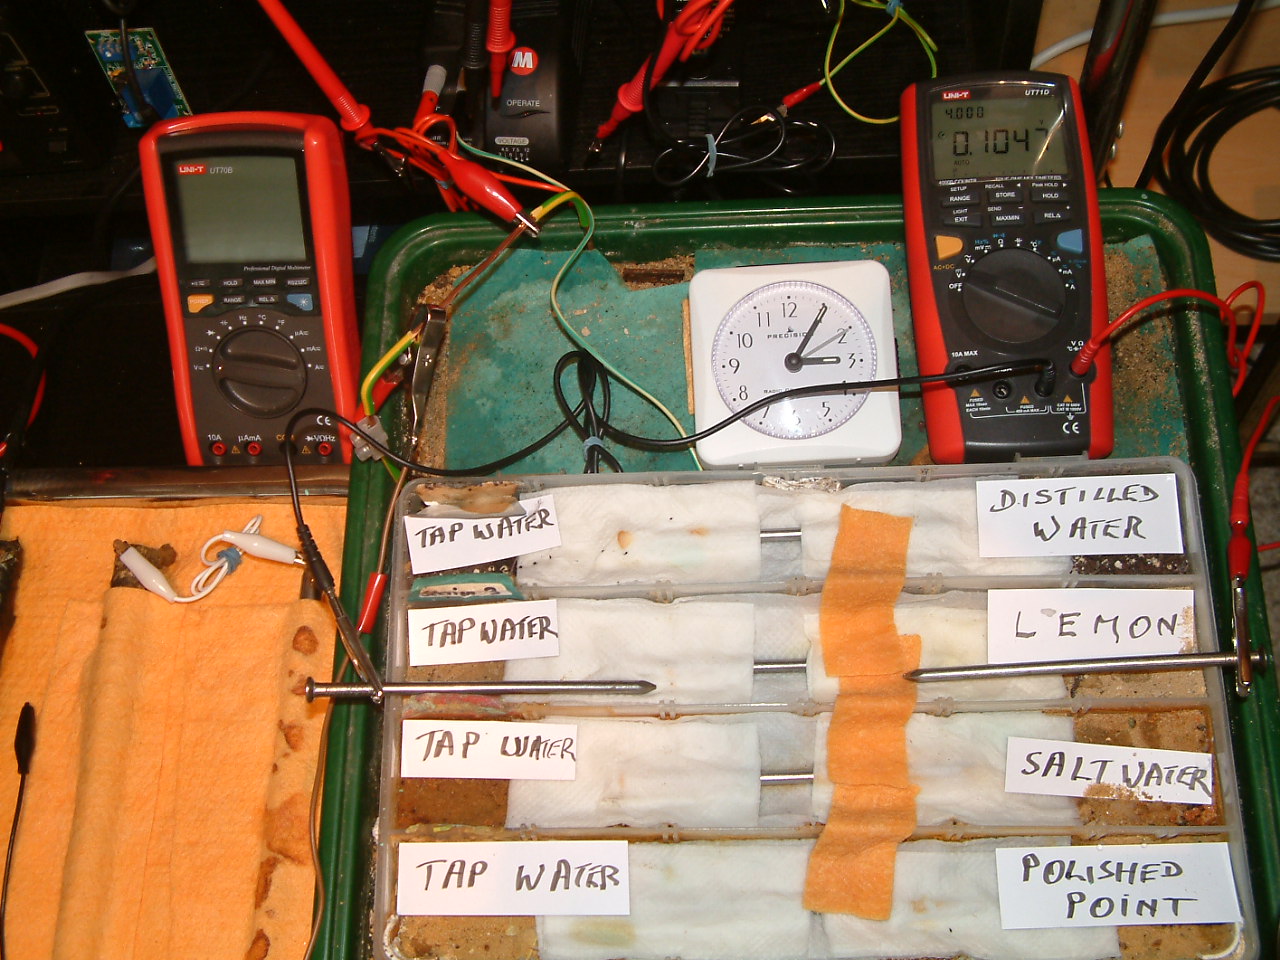
All partitions are bridged and the probe nails are now in partition three.
At 15:05 hrs the potential difference between the lemon juice area and the tap water is seen to be 0.1047mv
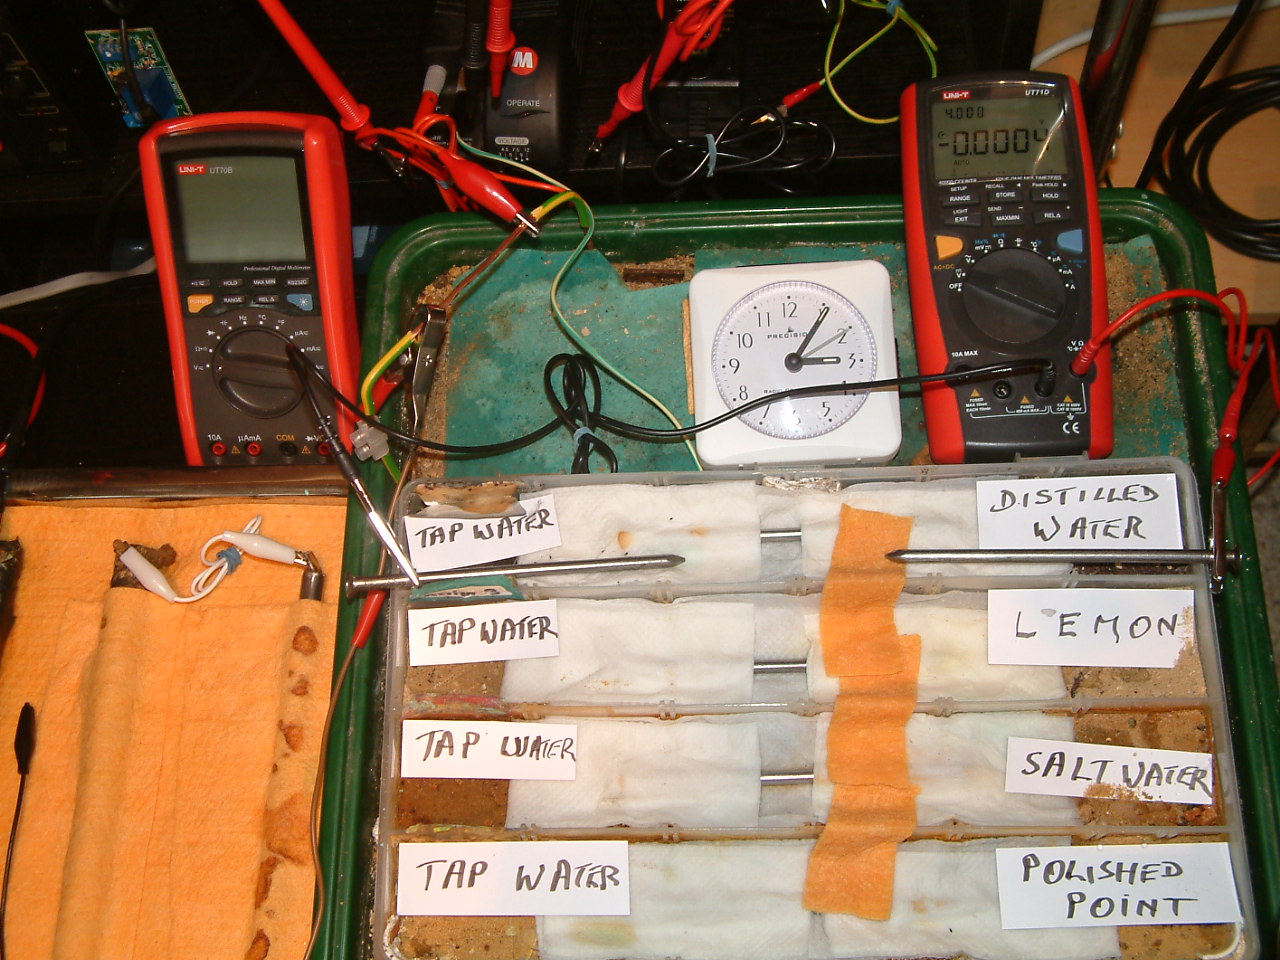
All partitions are bridged and the probe nails are now in partition four.
At 15:06 hrs the potential difference between the distilled water area and the tap water is seen to be 0.0004mv
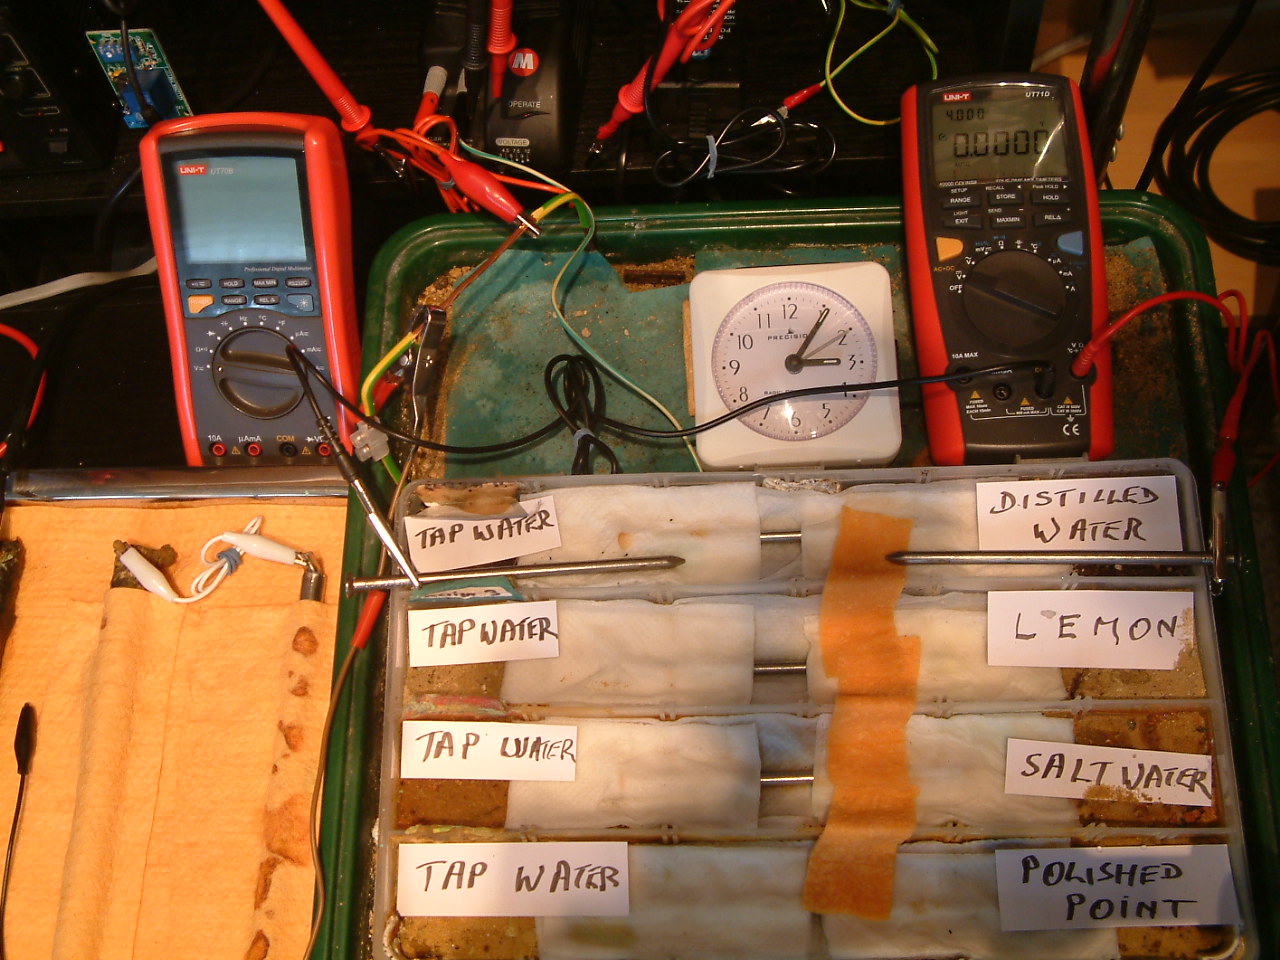
All partitions are bridged and the probe nails are now in partition four.
At 15:06 hrs the potential difference between the distilled water area and the tap water is seen to be 0.0000mv

All partitions are bridged and the 'common' probe nail is in partition four and the other is in partition three.
At 15:06 hrs the potential difference between the tap water area in partition four and the lemon juice area in partition three is seen to be -0.1899mv
All partitions are bridged and the 'common' probe nail is in partition four and the other is in partition two.
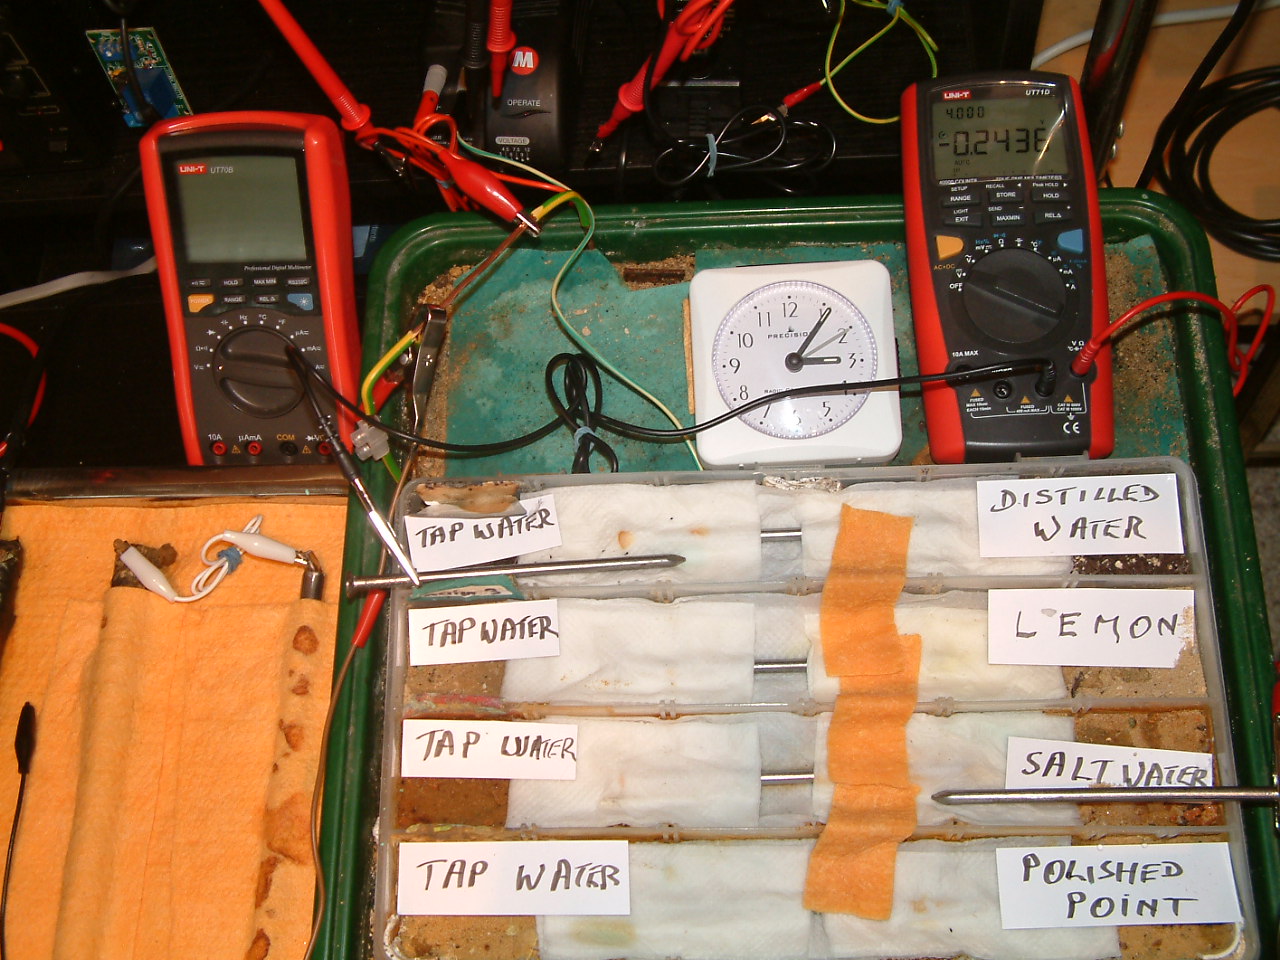
At 15:06 hrs the potential difference between the tap water area in partition four and the salt water area in partition three is seen to be -0.2436mv
All partitions are bridged and the 'common' probe nail is in partition four and the other is in partition one.
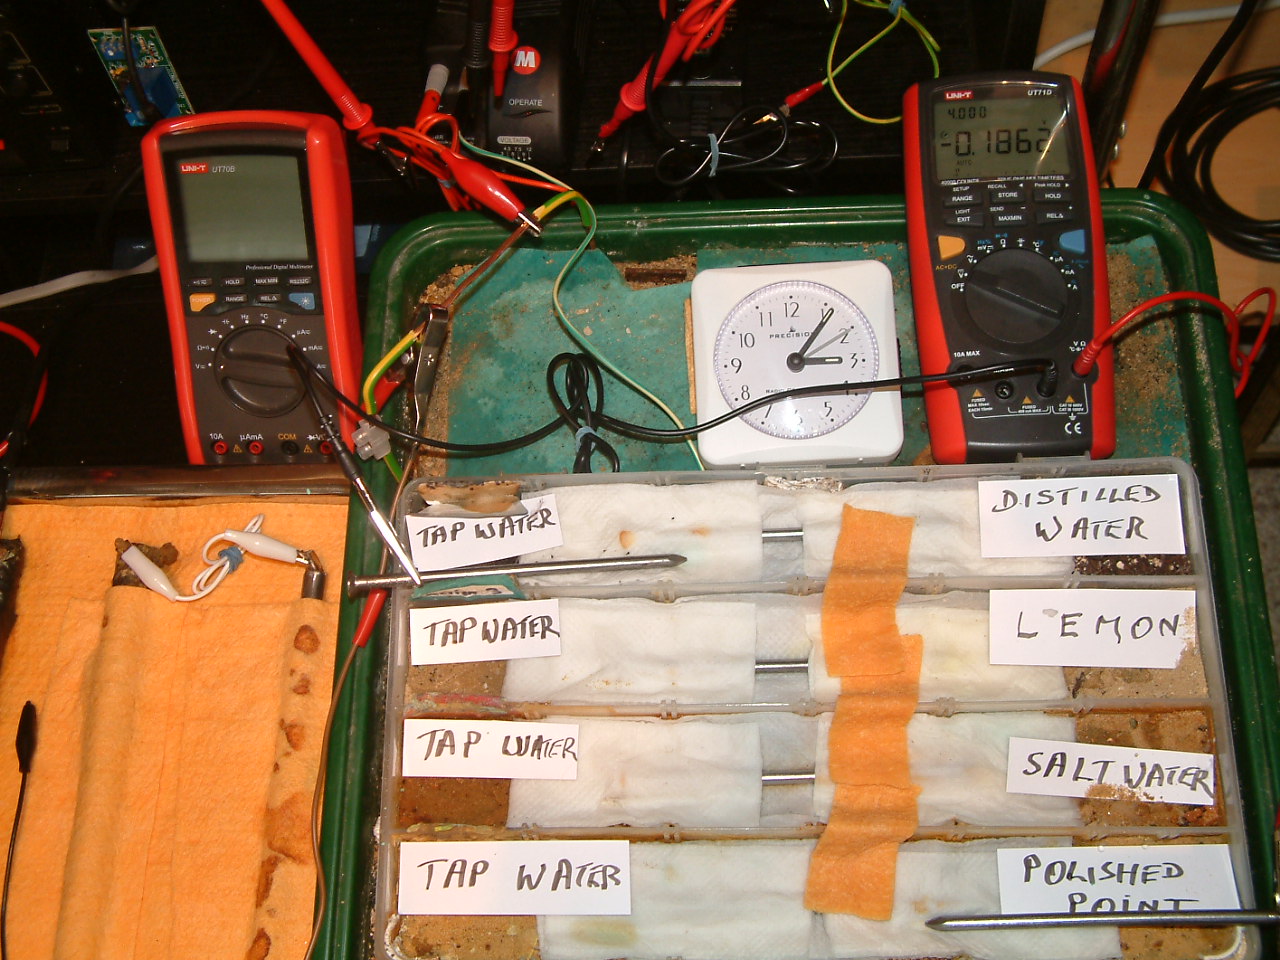
At 15:06 hrs the potential difference between the tap water area in partition four and the polished nail area in partition one is seen to be -0.1862mv
All partitions are bridged and the 'common' probe nail is in partition three and the other is in partition one.
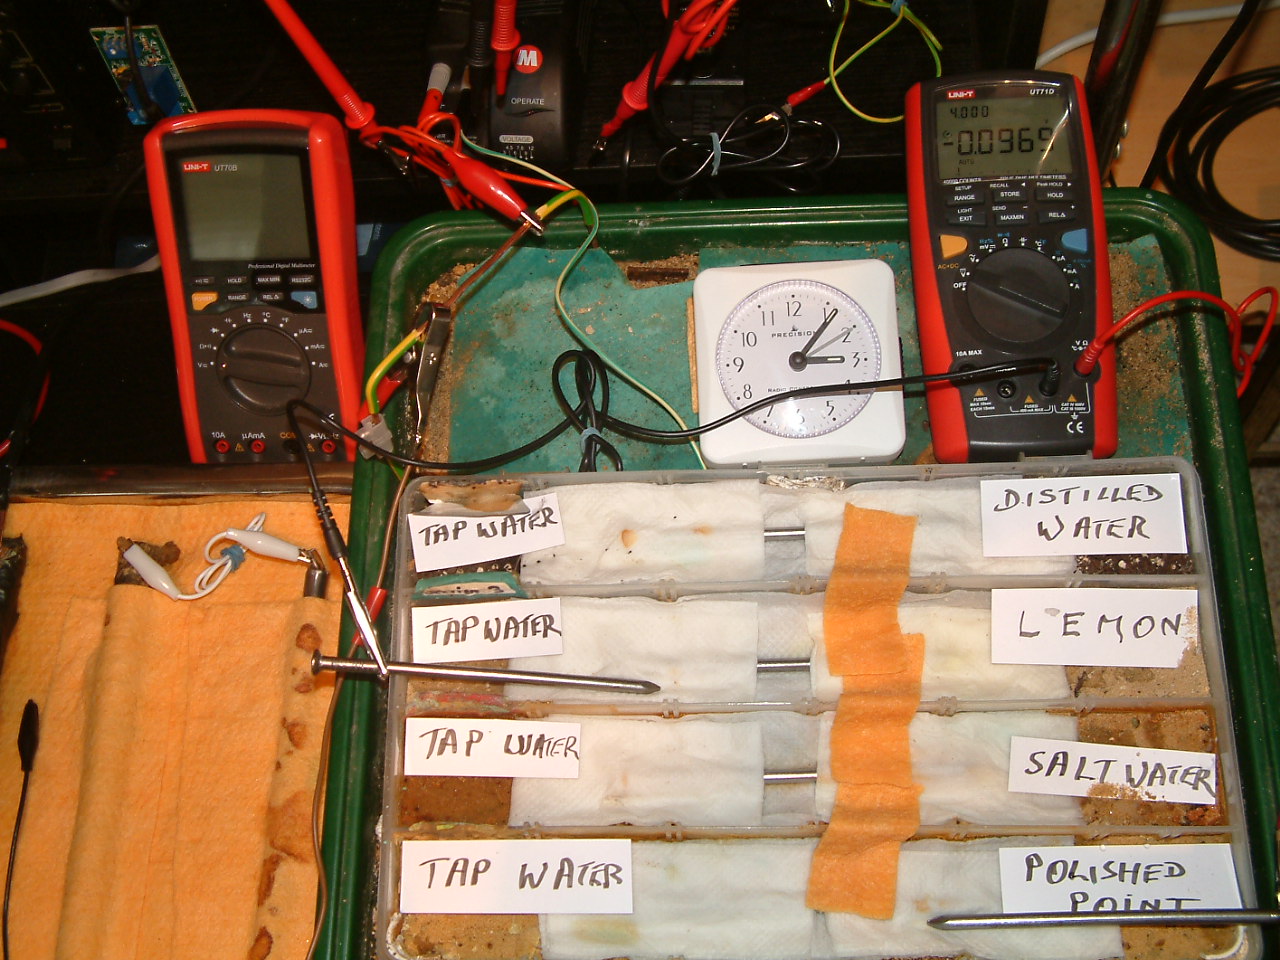
At 15:07 hrs the potential difference between the tap water area in partition three and the polished nail area in partition one is seen to be -0.0969mv

All partitions are bridged and the 'common' probe nail is in partition two and the other is in partition one.
At 15:07 hrs the potential difference between the tap water area in partition two and the polished nail area in partition one is seen to be -0.0692mv

All partitions are bridged and the probe nails are in partition one.
At 15:07 hrs the potential difference between the tap water area in partition two and the polished nail area in partition one is seen to be -0.1089mv

All partitions are bridged and the probe nails are in partition one.
At 15:07 hrs the potential difference between the tap water area in partition two and the polished nail area in partition one is seen to be -0.008mv

All partitions are bridged and the probe nails are in partition one.
At 15:07 hrs the potential difference between the tap water area in partition two and the polished nail area in partition one is seen to be 0.008mv
All partitions are bridged and the probe nails are in partition one.
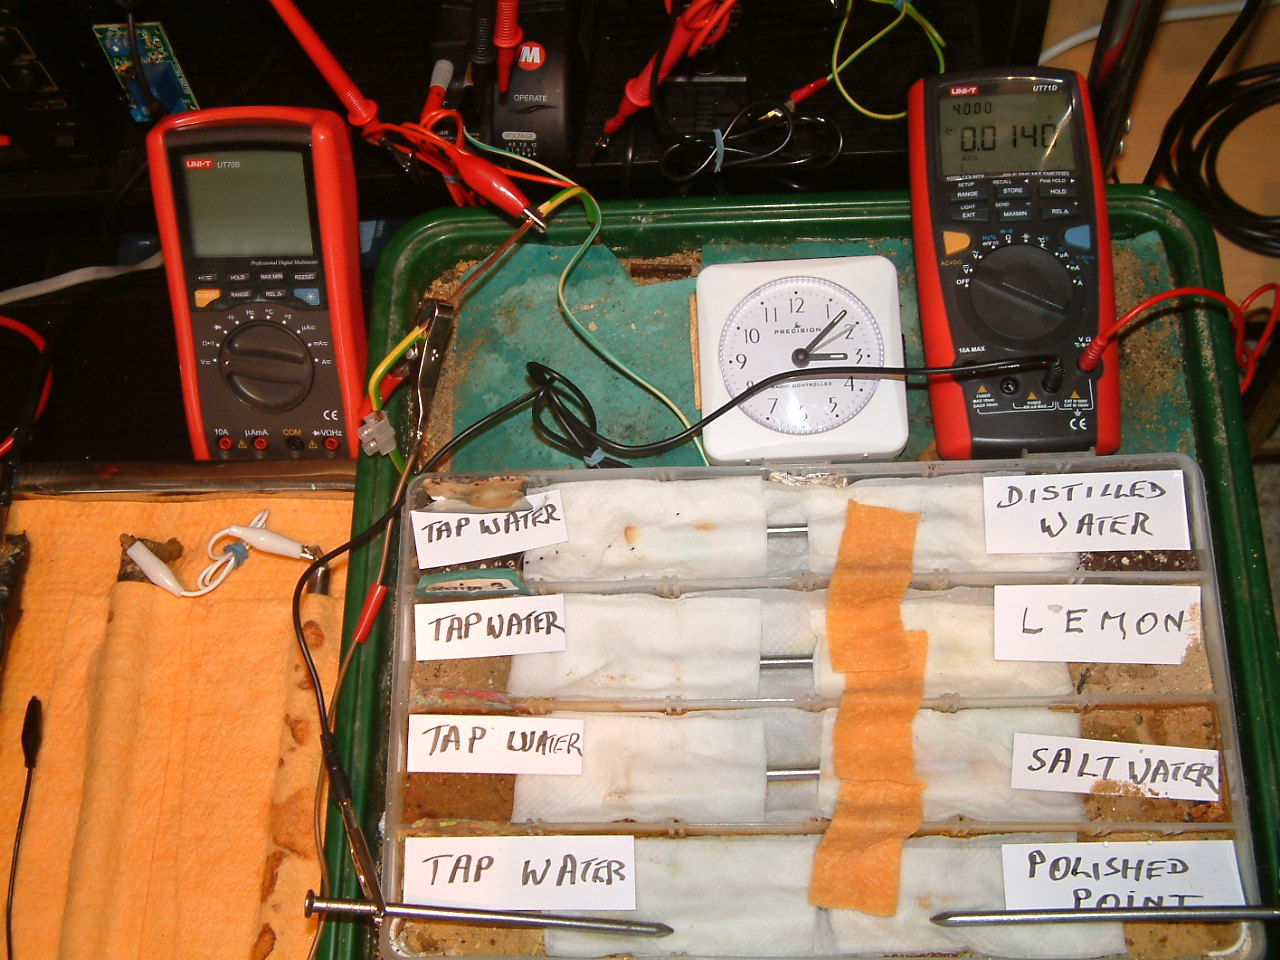
At 15:07 hrs the potential difference between the tap water area in partition two and the polished nail area in partition one is seen to be 0.0140mv

All partitions are bridged and the probe nails are in partition one.
At 15:07 hrs the potential difference between the tap water area in partition two and the polished nail area in partition one is seen to be 0.0248mv

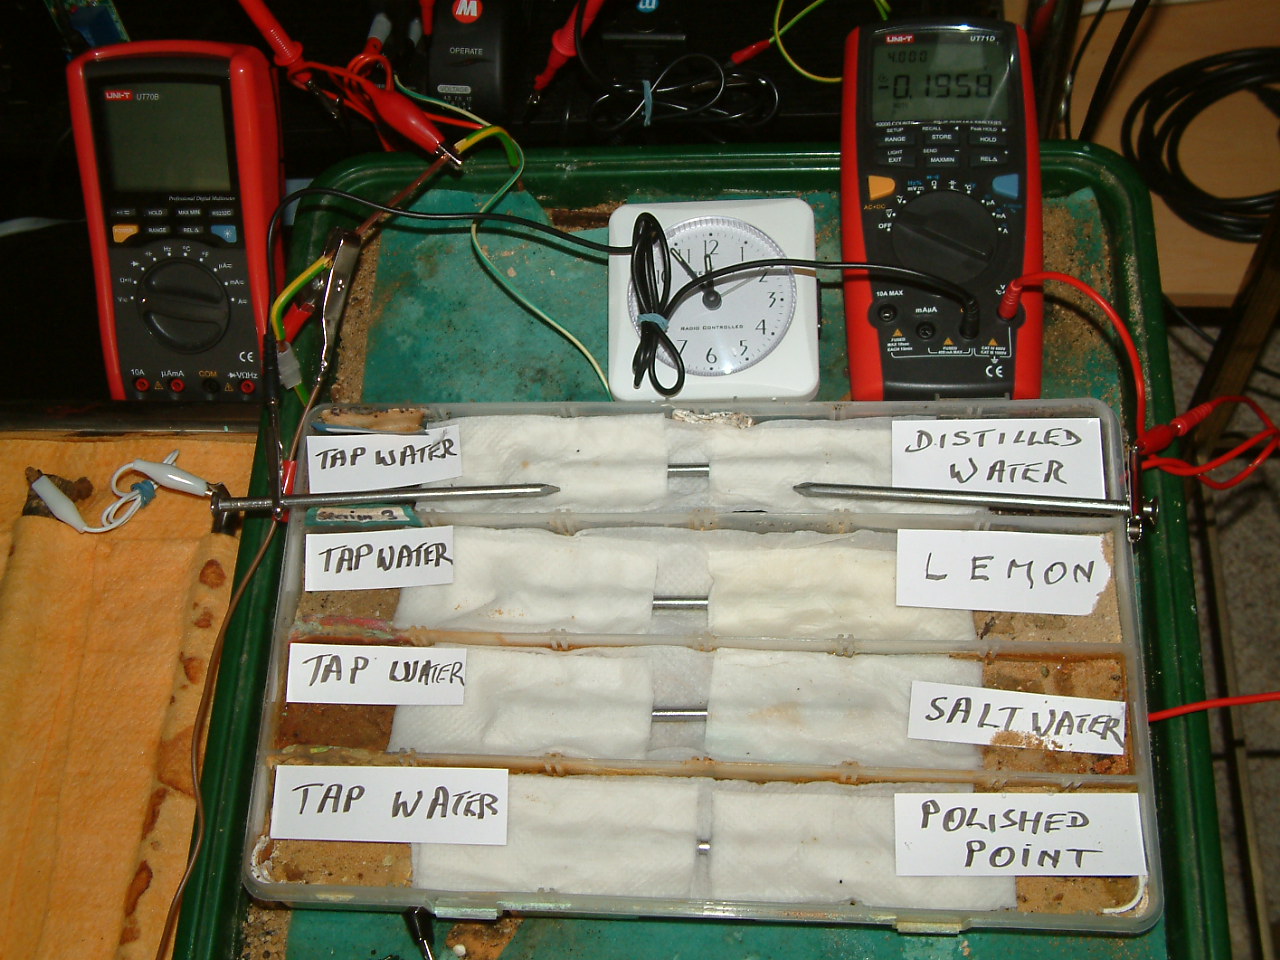
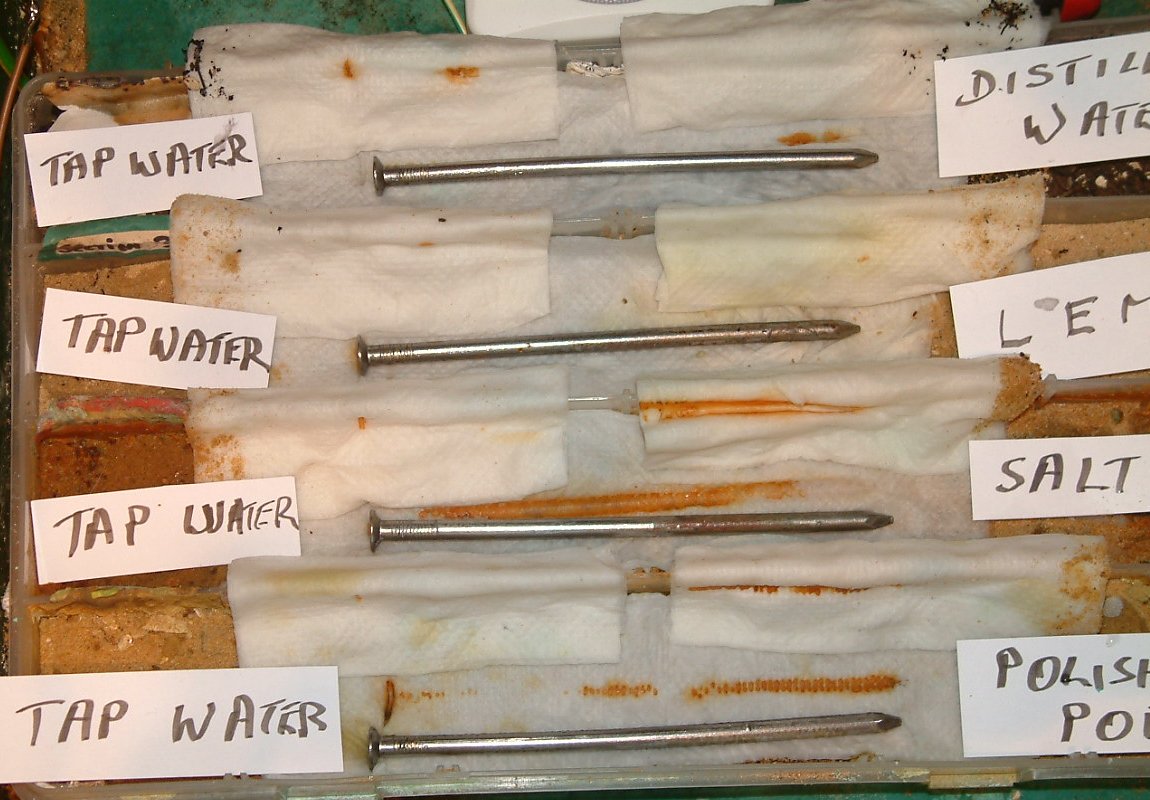
At 15:31 hrs the nails are uncovered and the covering paper is put to the back in a position that the corrosion products can be seen.
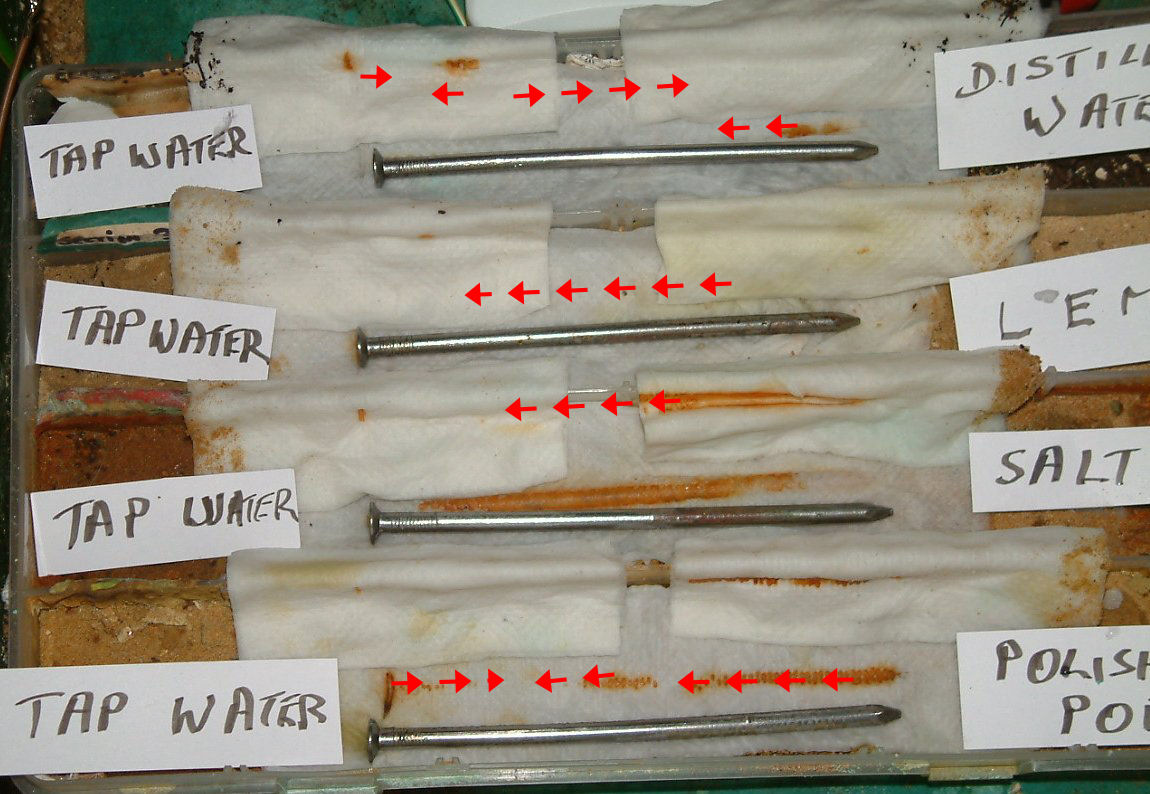
The arrows give an idea of the path of the charges through the electrolyte.

The return path in the corrosion cells is through the nail metal.
It must be remembered that the metal of the probe nails will react to the electrolyte that they touch. This reaction will add charges to those that are created by the subject nails.
This experiment shows that we are capable of measuring the potential of the electrolyte and that it does not matter if this potential is called positively charged ions, anions or cations, of what their symbol is in equations.
Examination of each picture helps to visualise the energy released by the corrosion reaction and how we can measure it.
The clock is valuable as it shows that the reaction changed over time and this might be called 'polarisation' and is not instant.
Link to next page
Email Cathodic Protection Network International Limited